Same data, two conclusions: why QC of single-color controls should come first
Two analysts open the same 15-color dataset. One finds what looks like novel T cell biology. The other concludes the data can’t be used. Neither made an unusual choice; they just looked at different plots. This post walks through how that happens, and why reviewing single-color controls first is the fastest way to prevent it.
Introduction: The Role of Single-Color Controls
In spectral flow cytometry, single-color and unstained controls supply the reference spectra that define the unmixing model, which converts raw detector signals into an abundance estimate for each fluorophore in the panel. Conventional cytometry follows the same logic with fewer detectors: the number of fluorophores typically equals the number of detectors, so we are taught to read controls in terms of peak emission and spillover, and the model's output as a compensation matrix rather than a set of reference spectra.
Either way, the controls are the ground truth for what an event stained with a single fluorophore looks like on an instrument, and how much of its signal is recoverable on neighboring detectors. Errors here propagate into every downstream estimate of protein abundance.
Because each single-color control measures exactly one fluorophore, the controls are more than the model's input. They are also its best test. Unmix the controls themselves and each one should show a signal in exactly one channel; anything else provides evidence that something is wrong. That gives three diagnostics:
- Unmixing and Compensation Fidelity: Evaluating unmixed single-color controls offers an objective check on unmixing accuracy. Because each single-color control contains only a single fluorophore, unexpected apparent co-expression in off-target channels flags issues such as inaccurate reference spectra, reference contamination, or tandem dye degradation.
- Measurement of Spreading Error: Spreading error is the noise that spillover correction cannot remove: photon-counting variance in a bright channel is carried by the compensation or unmixing into every detector that fluorophore spills into, widening the negative populations there. Single-color controls allow quantification of this spreading, via metrics like the Spillover Spreading Matrix (SSM), helping researchers assess population resolution limits and refine panel design (see Nguyen et al. 2013 for details).
- Reagent and Conjugate Validation: When controls are prepared using the exact antibody-fluorophore conjugates as the test samples, they double as quality controls for reagent integrity. Abnormally low staining or altered emission profiles signal reagent degradation, lot-to-lot variability, or improper storage conditions.
Single-color controls aren’t a setup step which we must endure before running the real experiment. They’re part of the experiment and, as the walkthrough below shows, sometimes the only reliable way to know whether a result is real.
Walkthrough: Discovery or Devastation
To make this concrete, we follow two hypothetical analysts working on the same unmixed dataset. Each takes a reasonable gating path, and we stop at the decision points that come up in real analysis.
Data: 15-color TBNK Immunophenotyping data (PBMCs) run on a 5L Cytek Aurora.
Unmixing: OLS (not on instrument), no AF columns were used.
Panel:
| Marker | Fluorophore |
|---|---|
| LiveDead | LD_Blue |
| CD45 | RB780 |
| CD3 | cFluor V420 |
| CD19 | cFluor B532 |
| CD56 | BV570 |
| CD4 | cFluor V610 |
| CD8 | cFluor V450 |
| CD16 | BV711 |
| CD14 | NovaYellow 690 |
| CD27 | APC-H7 |
| CD25 | BV605 |
| CCR7 | BB630 |
| CD45RA | BV480 |
| IgD | BV786 |
| CD127 | BUV737 |
Analyst 1: T cell gating path
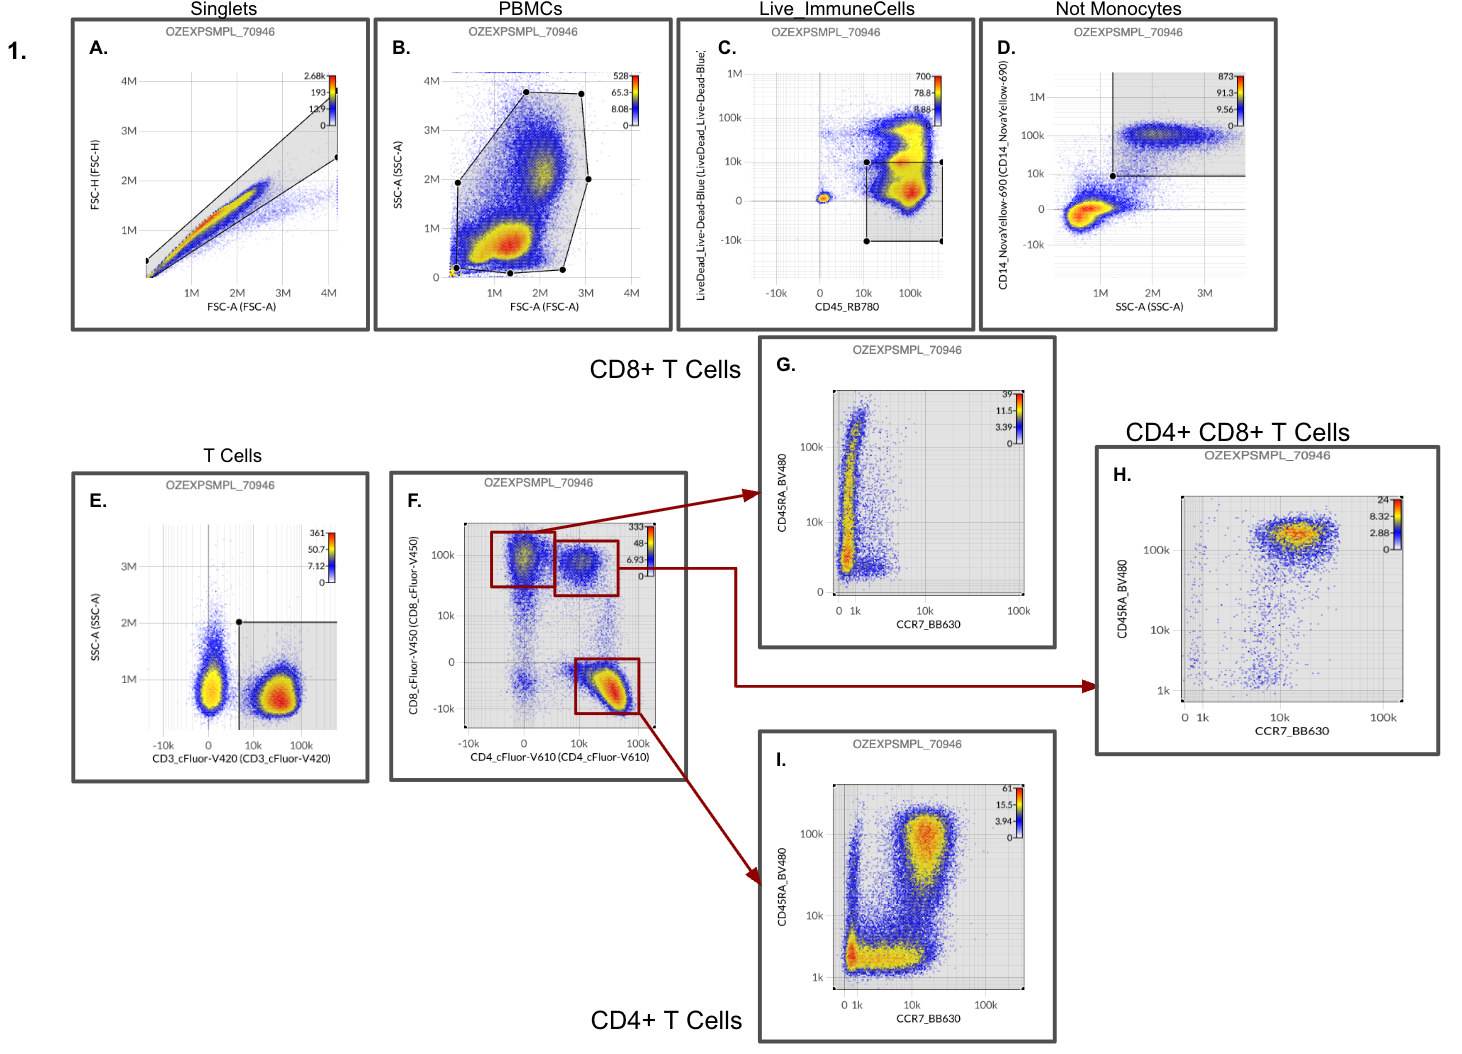
In the above gated data, Analyst 1 notes that CD8+ T cells seem to have lost their naive population, defined as CCR7+ CD45RA+, and very few if any central memory cells, defined as CCR7+ CD45RA-, are present (Figure 1G). The same is not true for CD4+ T cells (Figure 1I). Analyst 1 also notes that almost all of the double positive (CD4+CD8+) T cell population are naive, CCR7+CD45RA+ (Figure 1H).
Is the CD8+ T cell naive population in the bloodstream being replaced by the double positive naive population? The gated data certainly seems to point in that direction. In the gating path above, none of the parameters seem overtly suspect and the data seem well unmixed.
Given this scenario, Analyst 1 is ready to report the data. PDFs of the ideal gating path (Figure 1) will be prepared, and a numerical report of the populations will be provided for further downstream analysis. Analyst 1 may have also identified a novel observation, which will require further experimental validation: naive double positive T cells could potentially take over the niche of CD8+ T cells in the bloodstream!
Analyst 1 completes the analysis.
The gating path in Figure 1 provides a “clean” view of the data to T cells and their memory subsets. Overt unmixing issues are not immediately apparent. Although keen observers may have noticed some overcorrection of CD8 unmixed values within the CD4+ T cell population in Figure 1F, as well as overcorrection of CD14 in Figure 1D. The full panel is 15 markers and in the gating path of analyst 1 gating decisions based on 8 parameters.
Analyst 2: Alternate T cell gating path
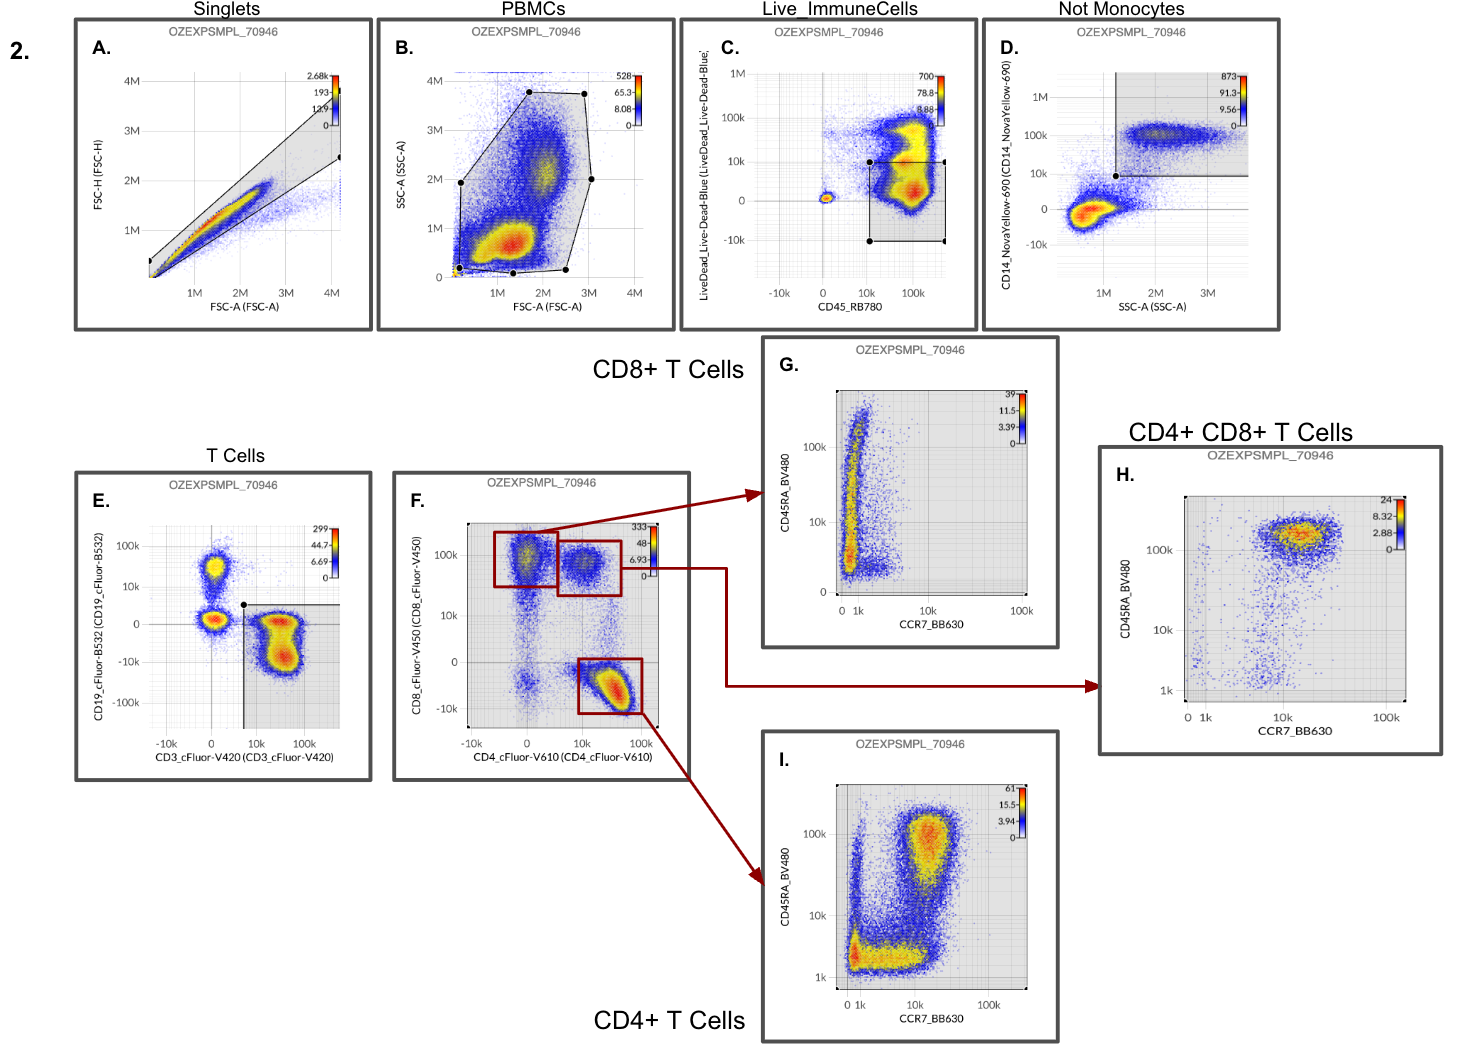
This panel affords T cell identification not just by CD3 inclusion but also exclusion of CD19 (i.e., T cells are defined as CD3+ CD19-). Analyst 2 takes the gating path in this dataset to include a CD19 vs CD3 view instead of SSC vs CD3 (see Figure 2E vs 1E), keeping the rest of the gating decisions the same as Analyst 1. Analyst 2 notes that there is an obvious overcorrection of CD19 (cFluor B532) on CD3+ (cFluor V420) cells. However, the observations provided by Analyst 1 regarding naive population in CD8+ and CD4+CD8+ T cells (from Figure 1) continue to hold.
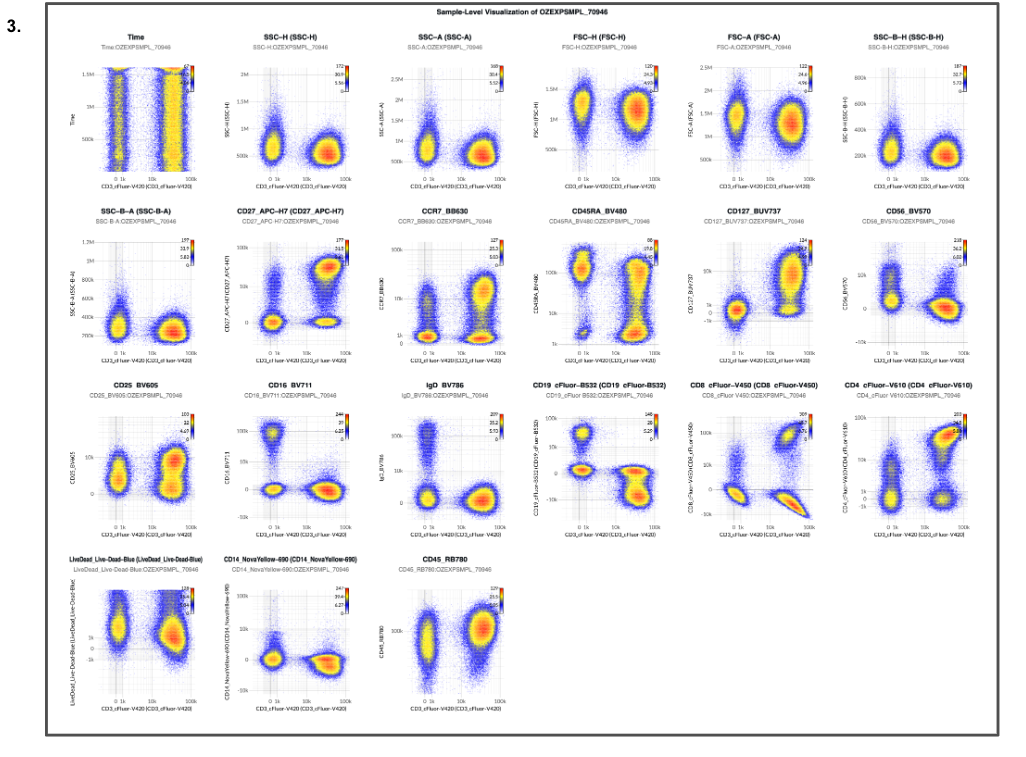
Reviewing a 1 × N plot of CD3+ T cells with CD3 on X axis and varying Y axis (Figure 3), Analyst 2 notes overcorrection of CD8, CD19, and CD14 unmixed values, re-validating the observations from Figure 2.
Reviewing additional 1 × N plots of CD3+ T cells with CD19 (Figure 4) on X axis and CCR7 (Figure 5) on X axis with varying Y axis, however, leads to a devastating finding: there are severe unmixing errors lurking in the data with various parameters over or undercorrected!
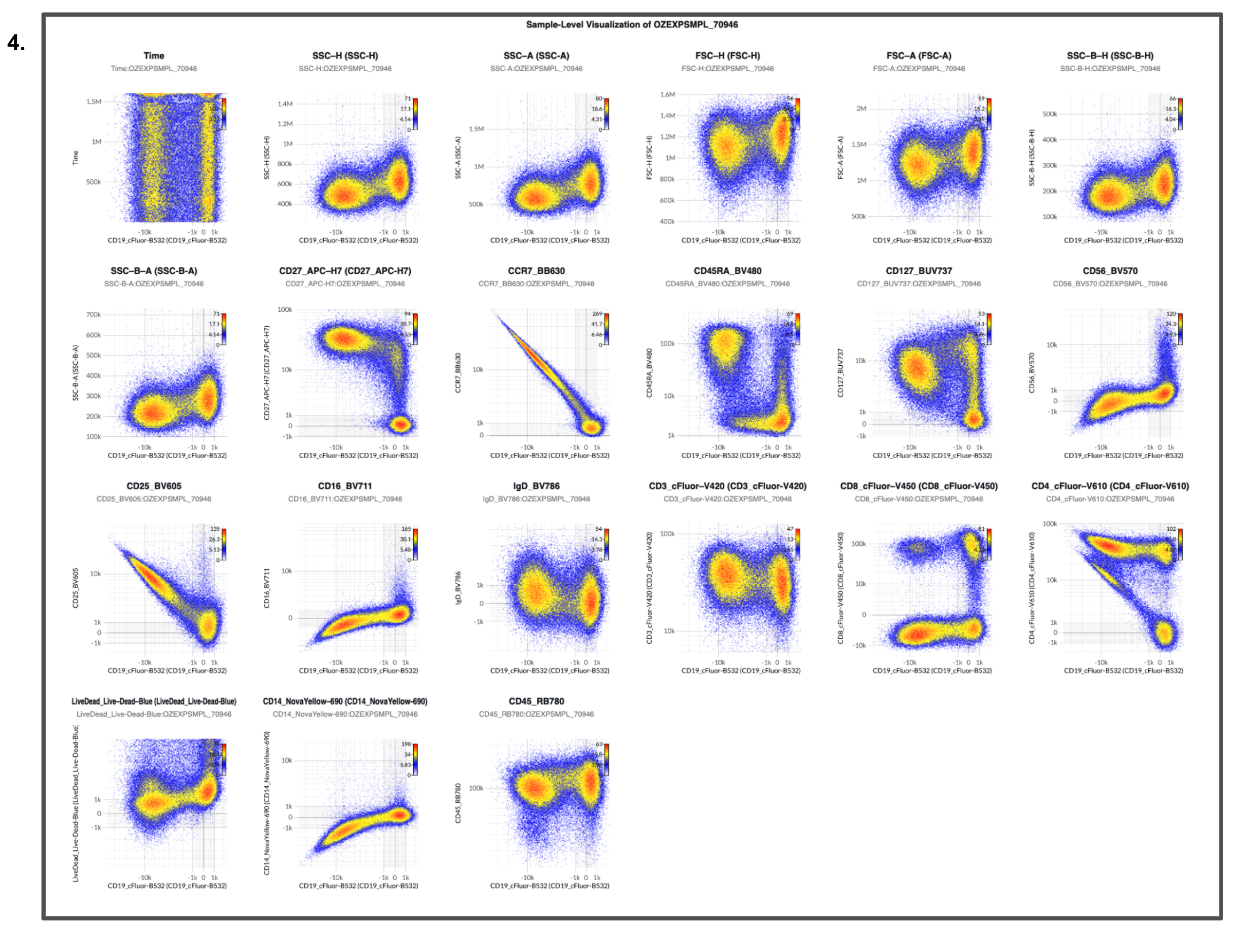
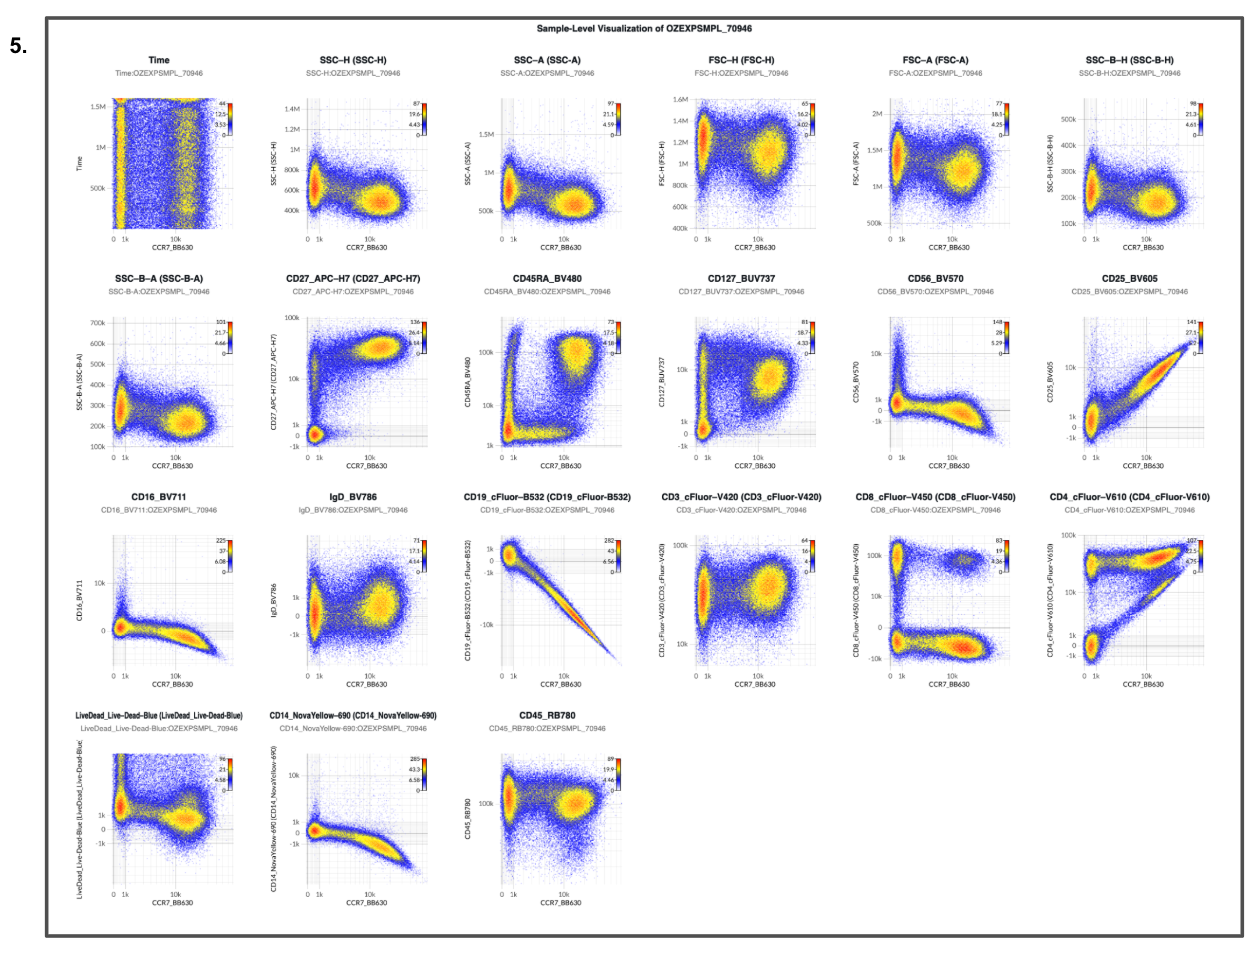
The CD4+CD8+ naive population that was hypothesized (Figures 1 and 2) to be replacing the CD8+ naive niche is an unmixing artifact: errors in the model surfacing as a novel co-expression pattern.
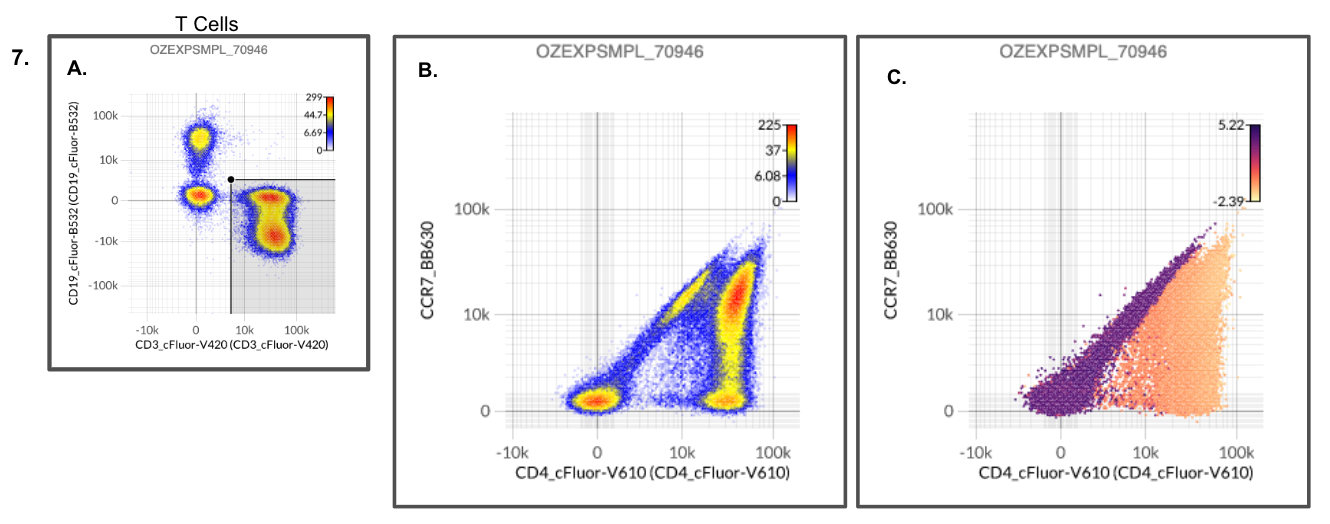
As noted in Figure 6 (column 2), plotting the gated data for each T cell population from Figure 2 (Panels G, H, and I) with CCR7 on the X axis and CD19 on the Y axis, the overcorrection is immediately apparent. Figures 7B and 7C show what happened: the naive CD8+ T cells never disappeared. Undercorrected CCR7 (BB630) signal bled into the unmixed CD4 (cFluor V610) signal, so CCR7-bright naive CD8+ cells looked CD4+ and landed in the double-positive gate.
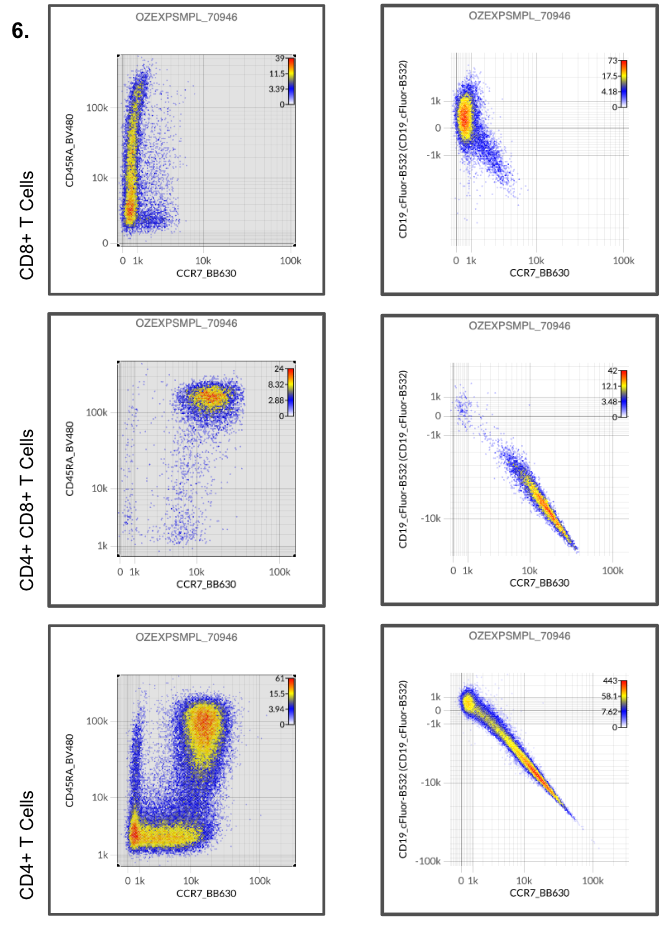
Analyst 2 indicates that given these observations, data analysis cannot proceed until errors have been remediated.
“But the experiment is already completed, can’t we salvage something?”
The analyst reviewing these results may want to “salvage” the data and a common crutch used in such scenarios is to compensate the unmixed data (for data generated on a spectral instrument) or further manually modify the compensation matrix (for data generated on a conventional cytometer).
These approaches can further add subjectivity and bias to the analysis as the anchor for a correct result (or what passes as correct) is based on what the analyst expects a true co-expression pattern should look like.
More critically, cytometry produces a multivariate measurement, so adjusting one parameter doesn’t guarantee that only that parameter changes. Post-unmixing compensation is like trying to solve a Rubik’s cube one face at a time. You can make the face you’re looking at come out right, but every twist also moves pieces on the faces you aren’t looking at. A bivariate plot that looks corrected can hide new errors in every other pair that shares the adjusted parameter. The fix is to correct the controls and unmix again.
Same data, two conclusions
Depending on the gating path, the same dataset yields a “discovery” or a “devastation”. The conclusion should not depend on which plots the analyst happened to draw.
Herein lies the dilemma of cytometry data analysis. Any cytometry experiment (that is measuring more than 1 parameter) is multivariate. However, gating and data review is generally performed by selecting 2 parameter pairs out of convenience and tooling. It is difficult if not impossible to visualize 3, 4, 5, or more parameters. Unmixing errors can hide in the pairs nobody plots.
Controls are the direct check on the model. Each single-color control contains one fluorophore, so unmixing it should assign abundance to exactly one channel. Any signal elsewhere indicates an error, visible before a single experimental file is gated.
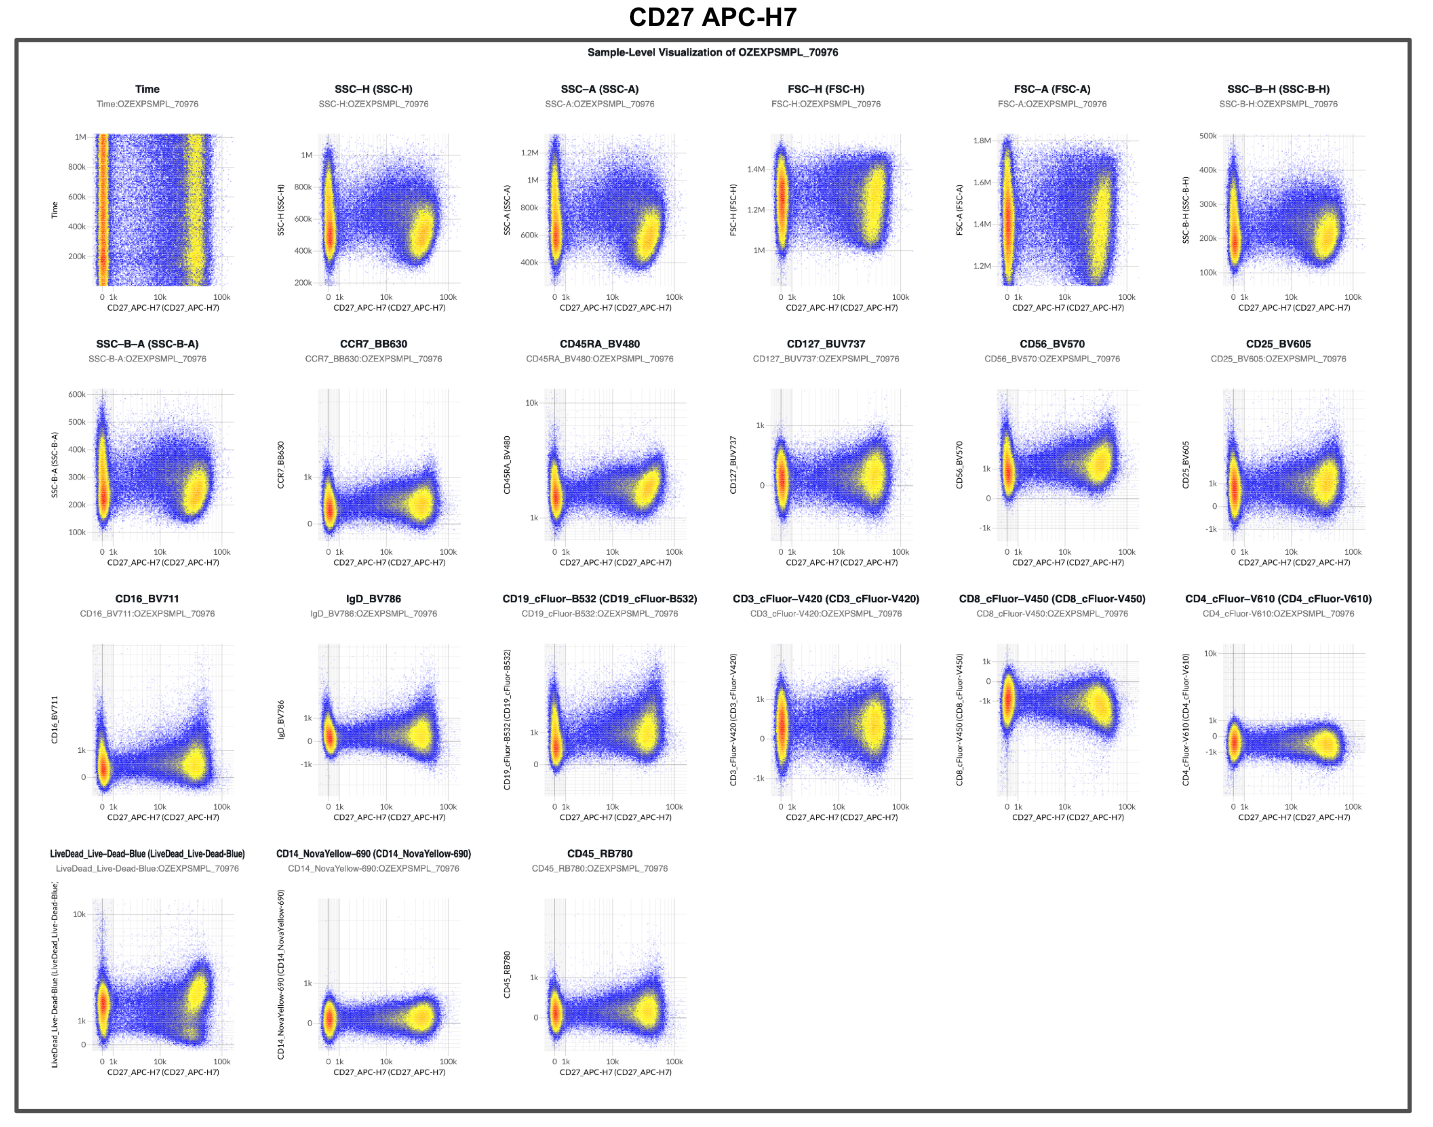
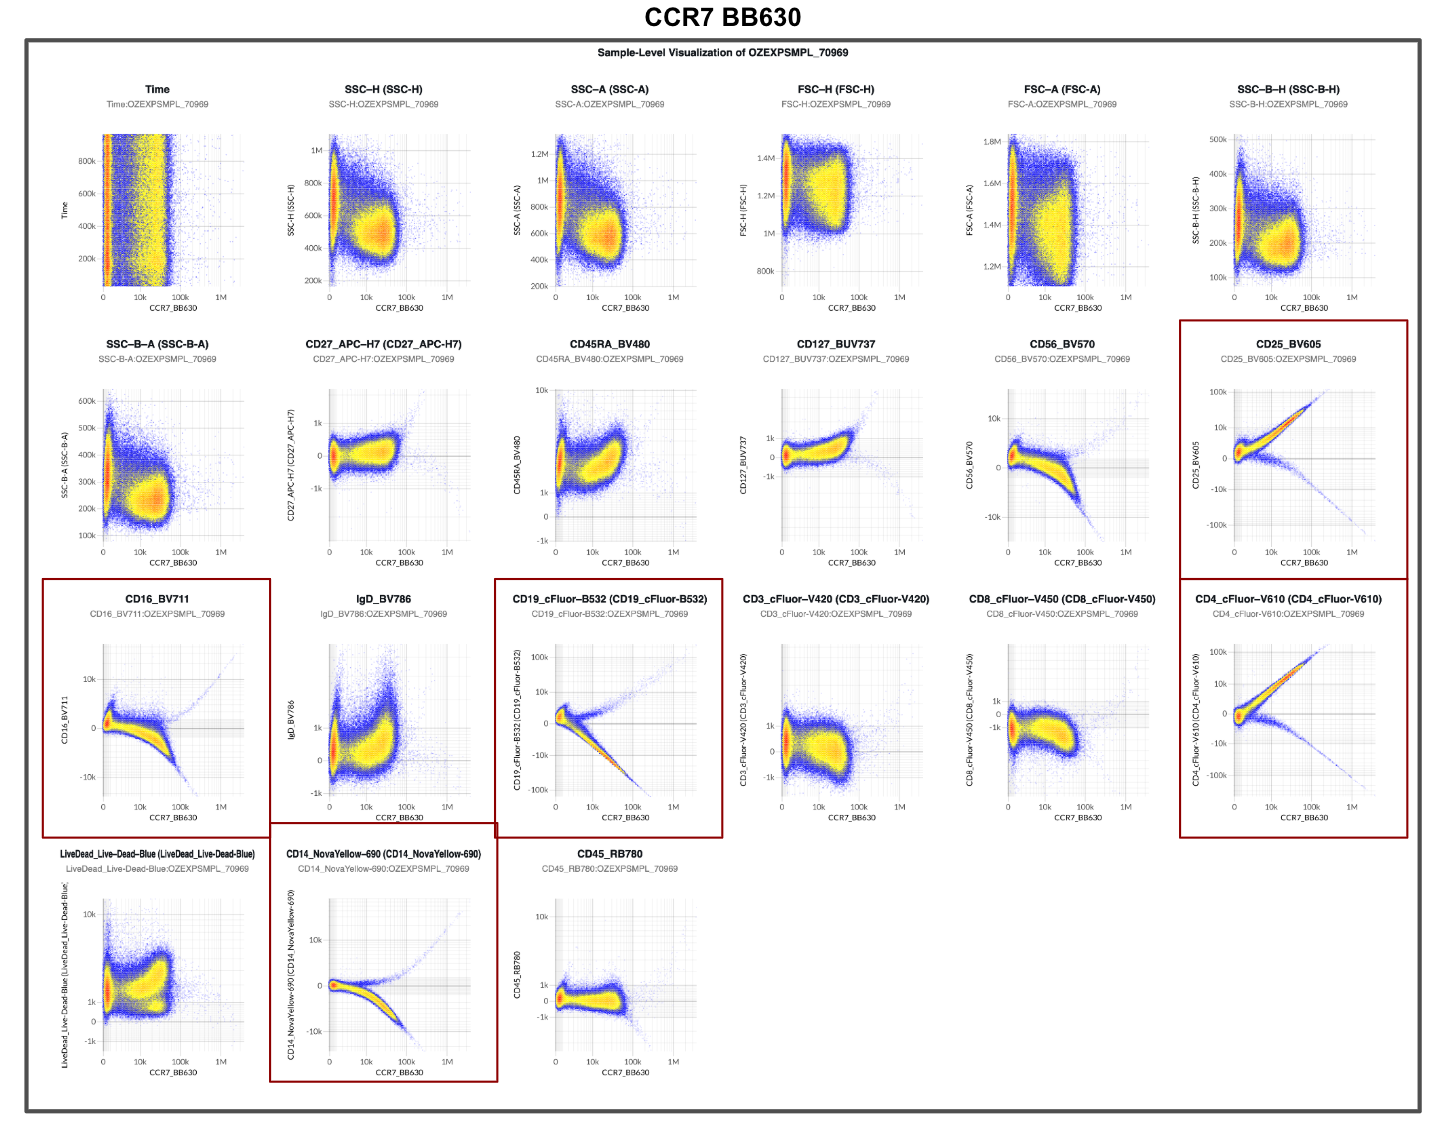
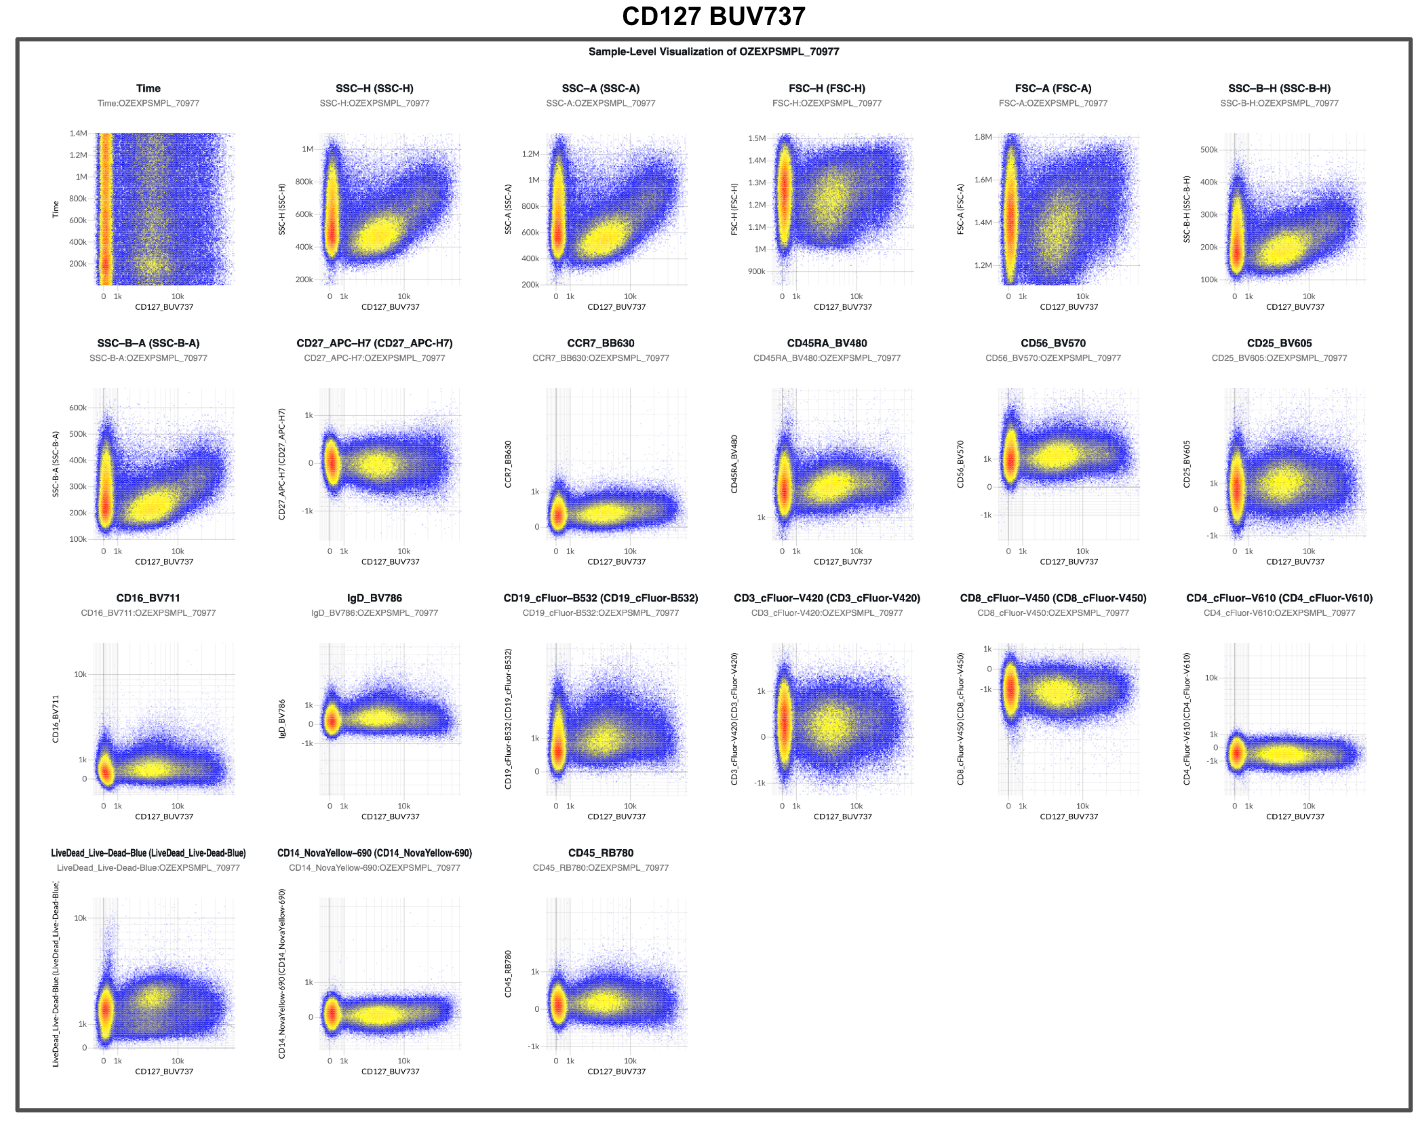
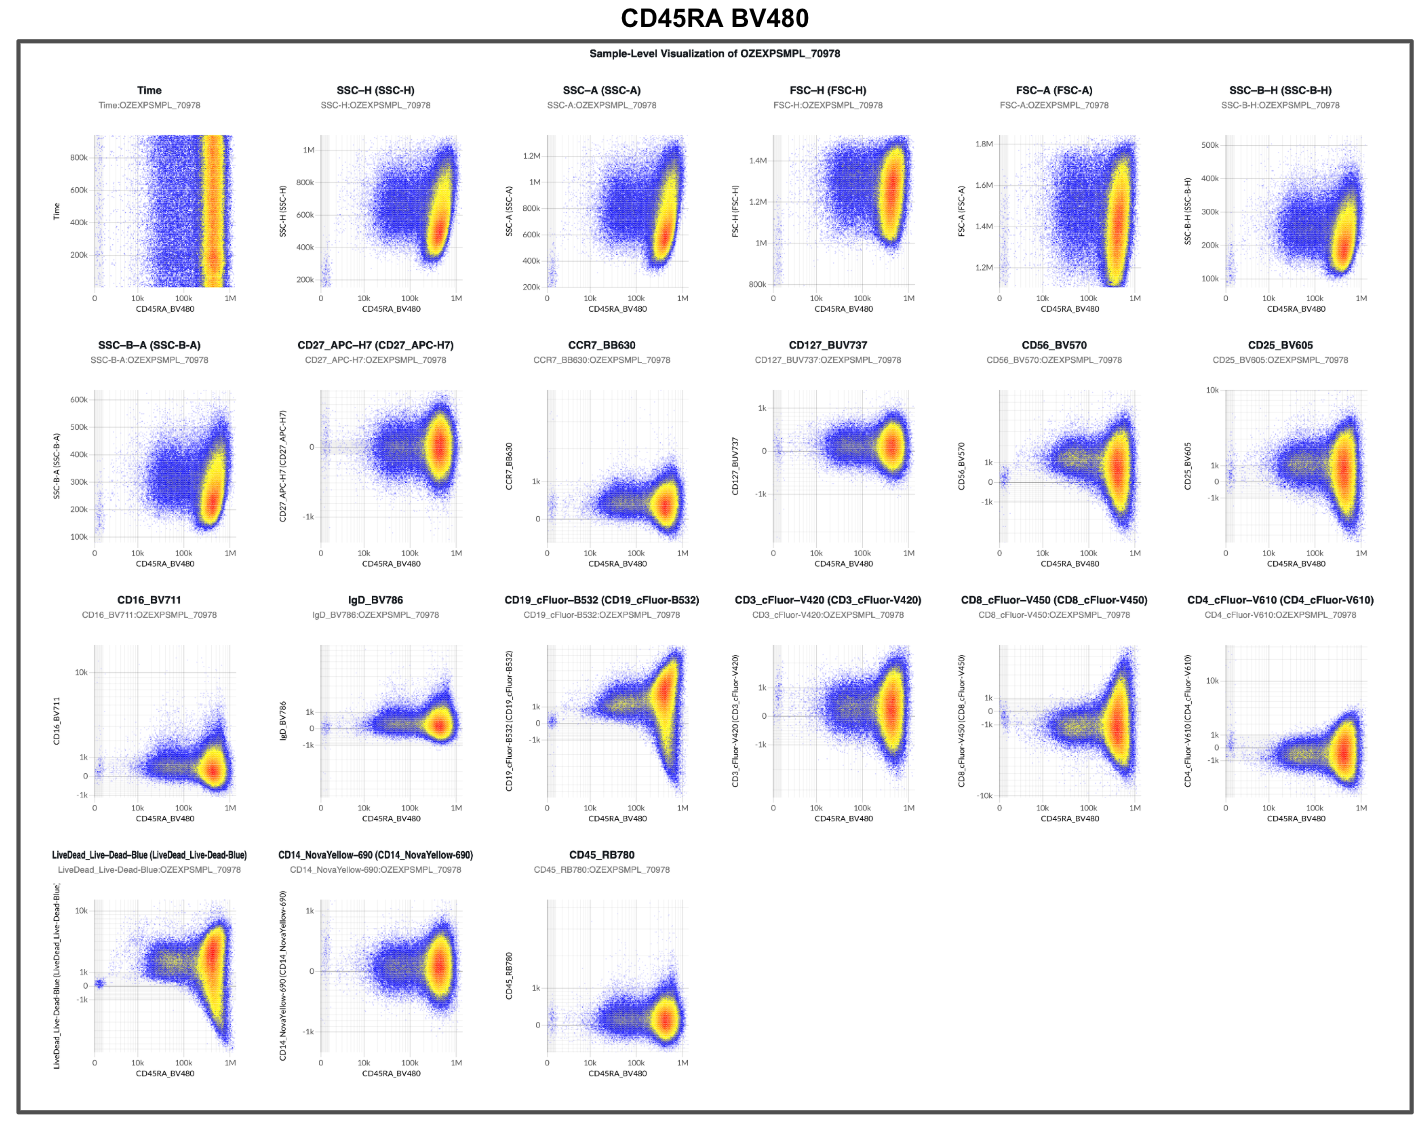
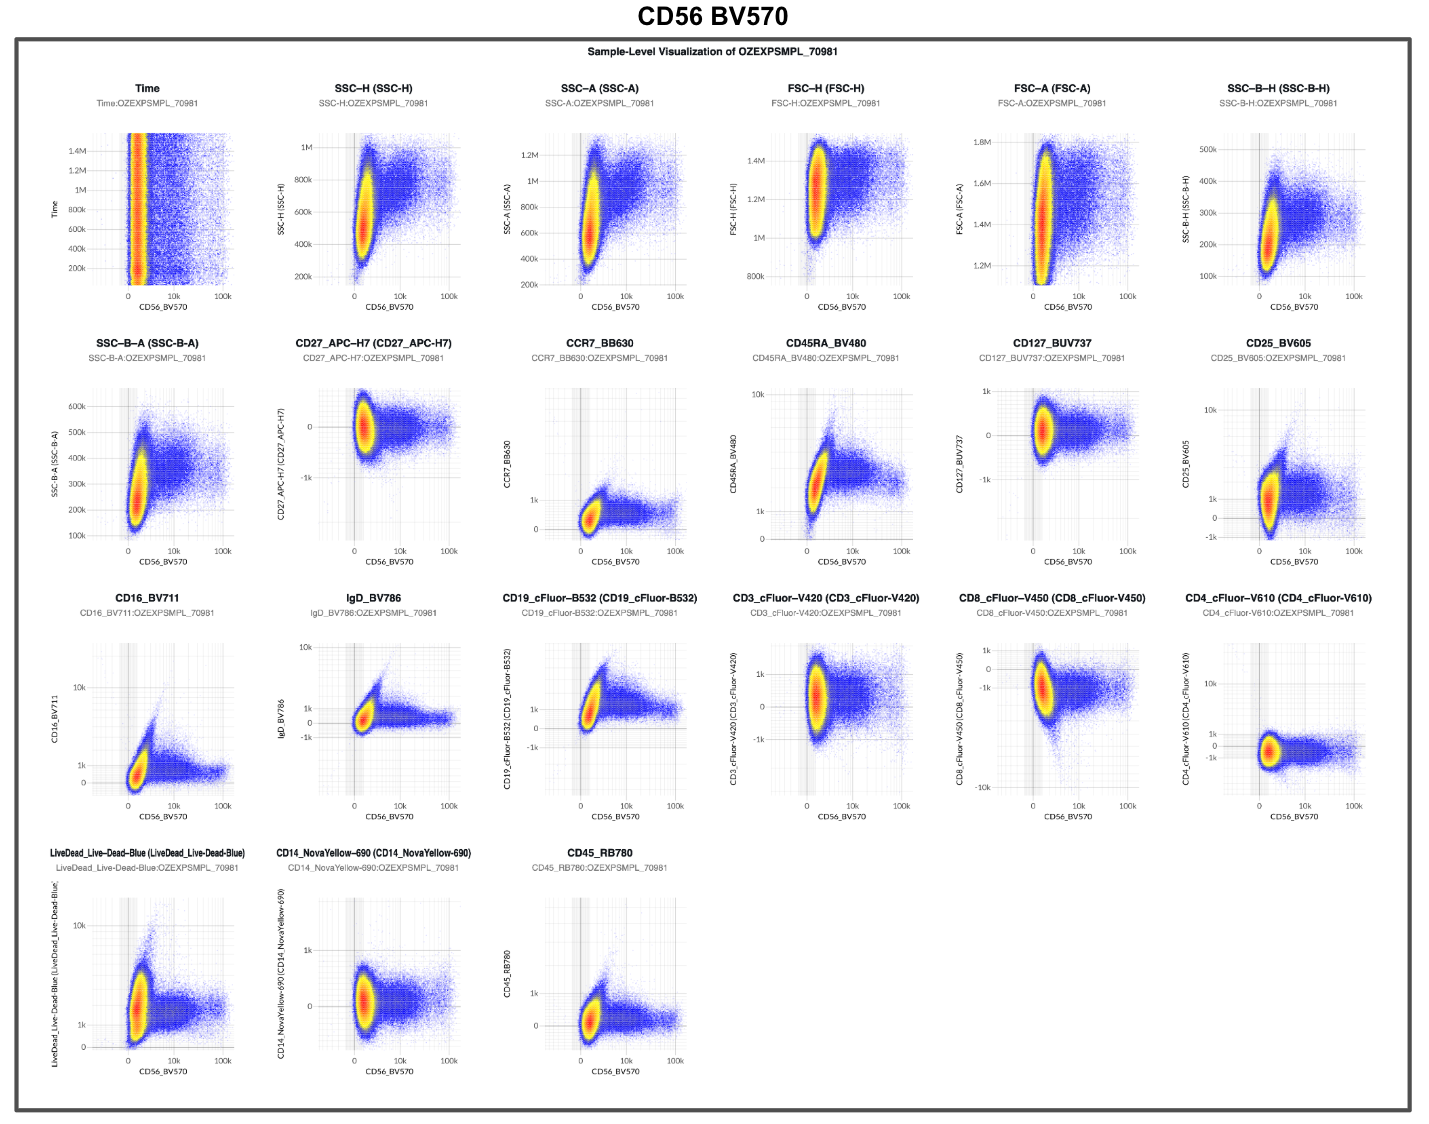
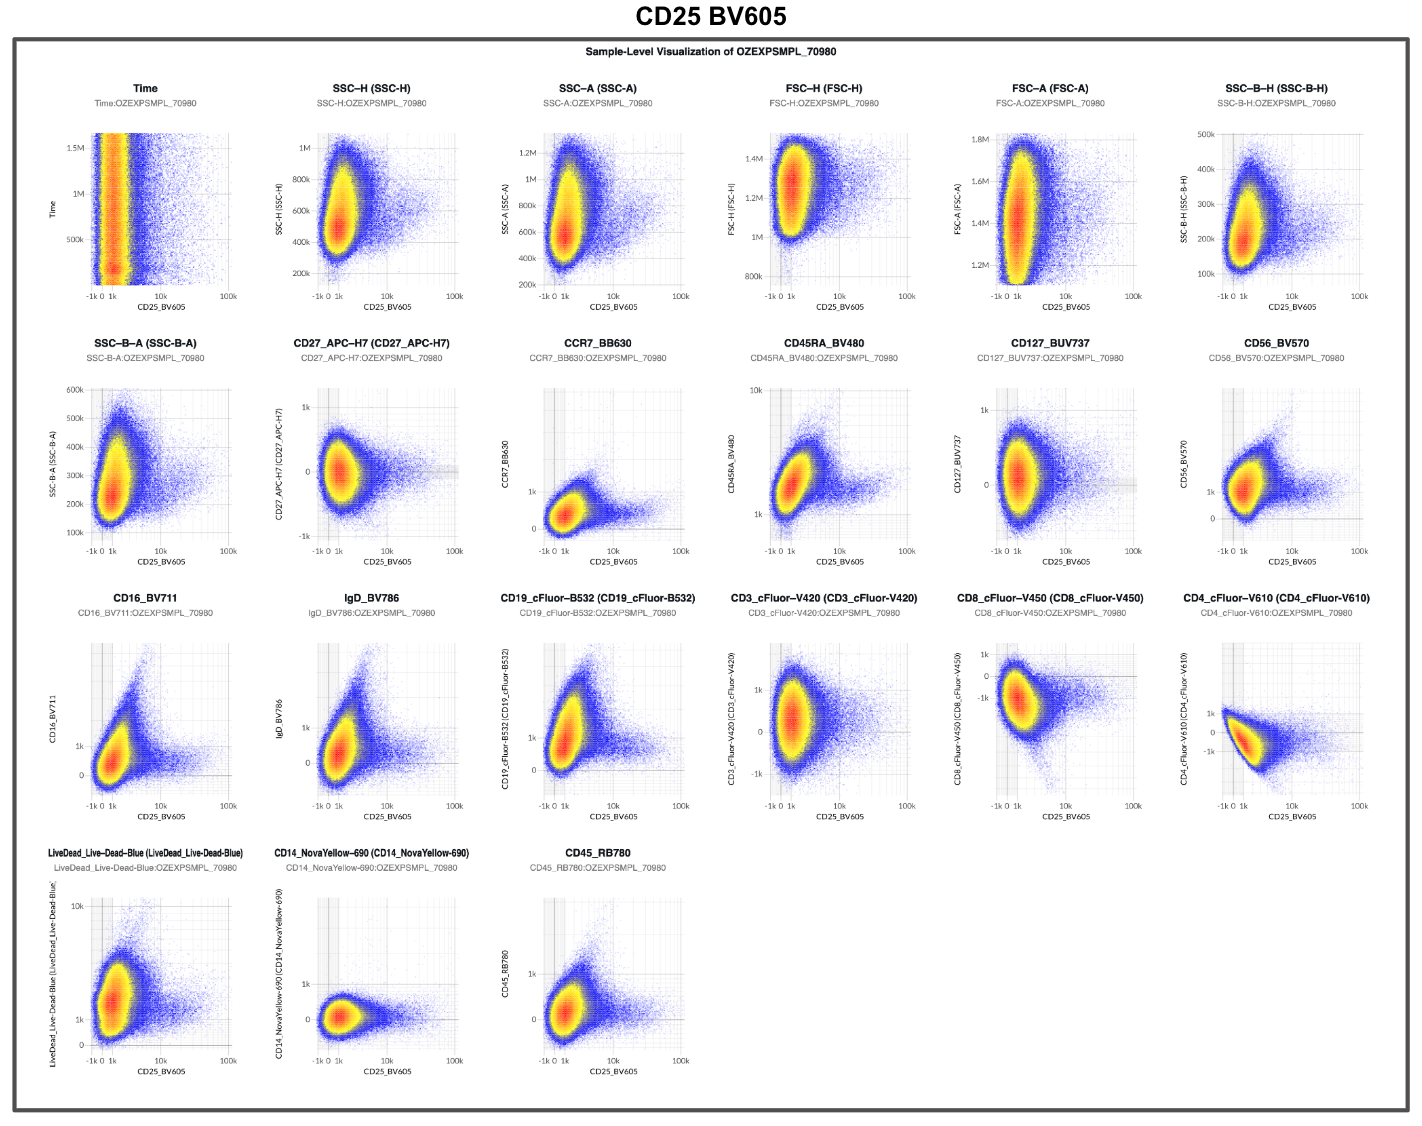
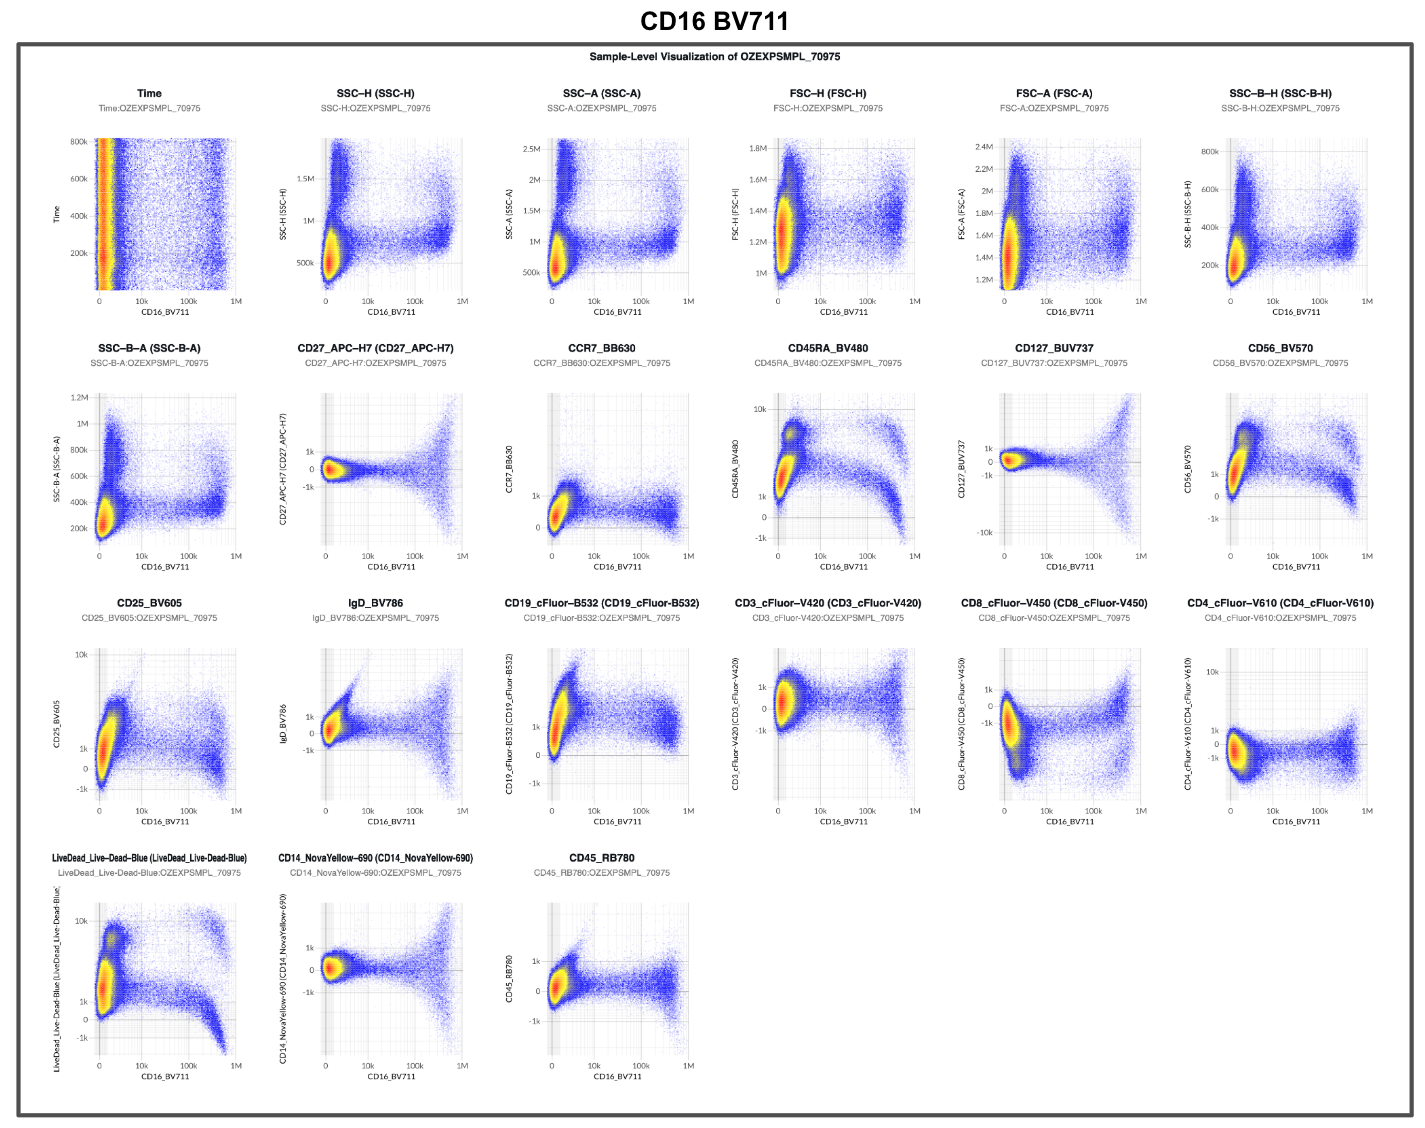
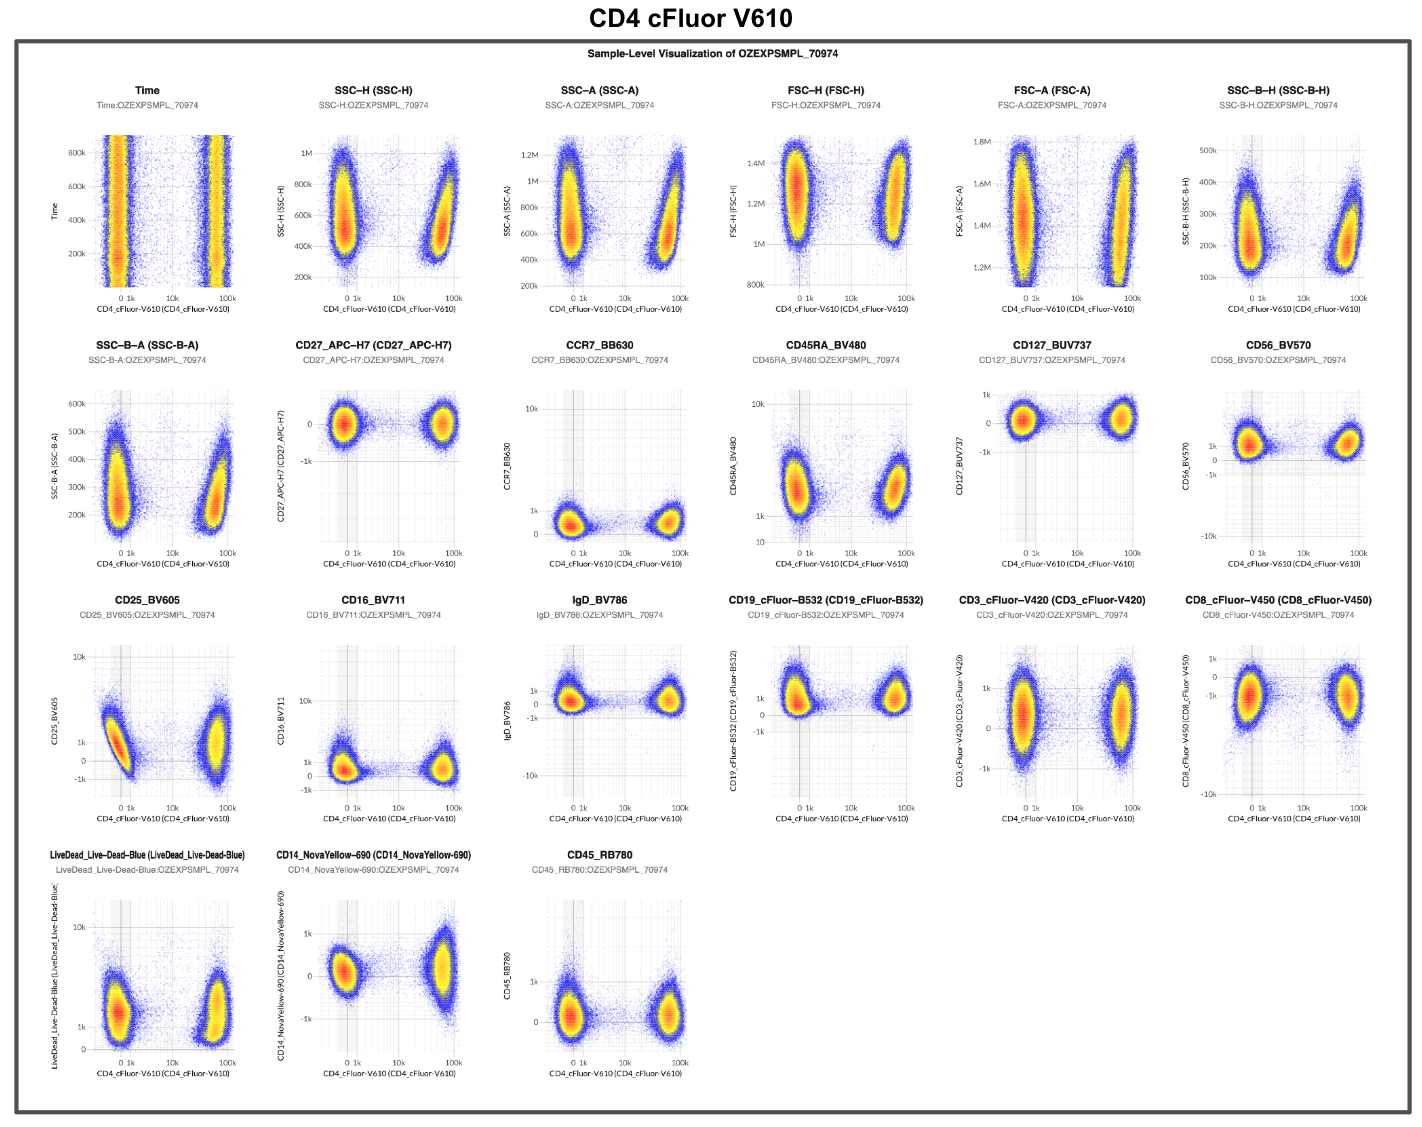
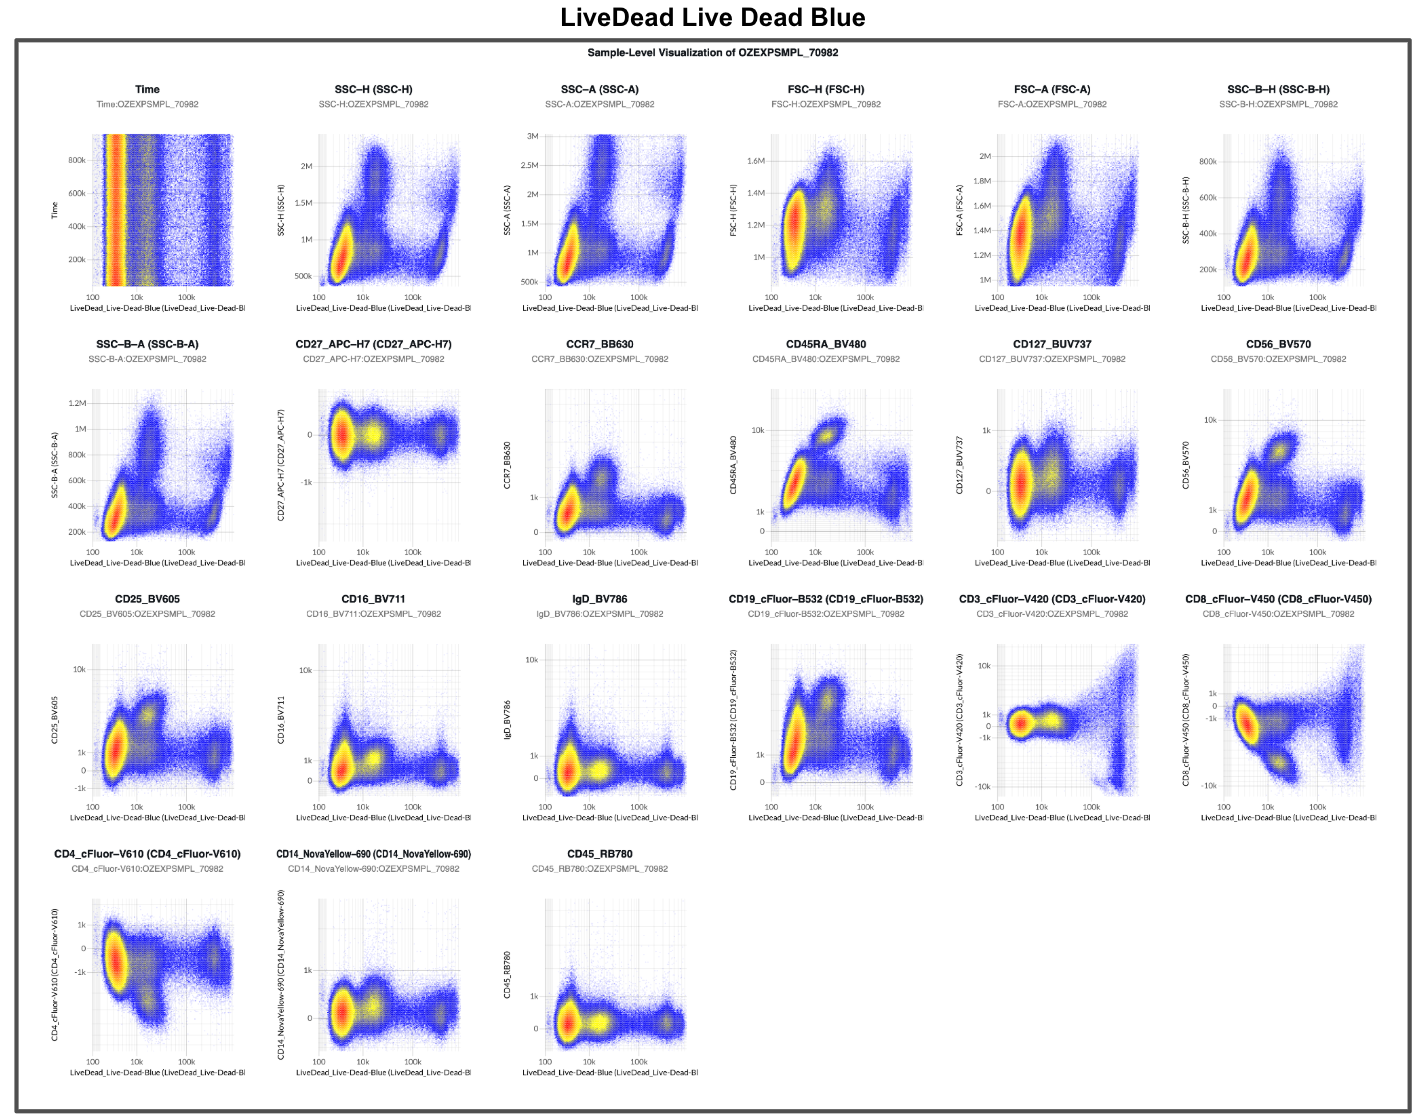
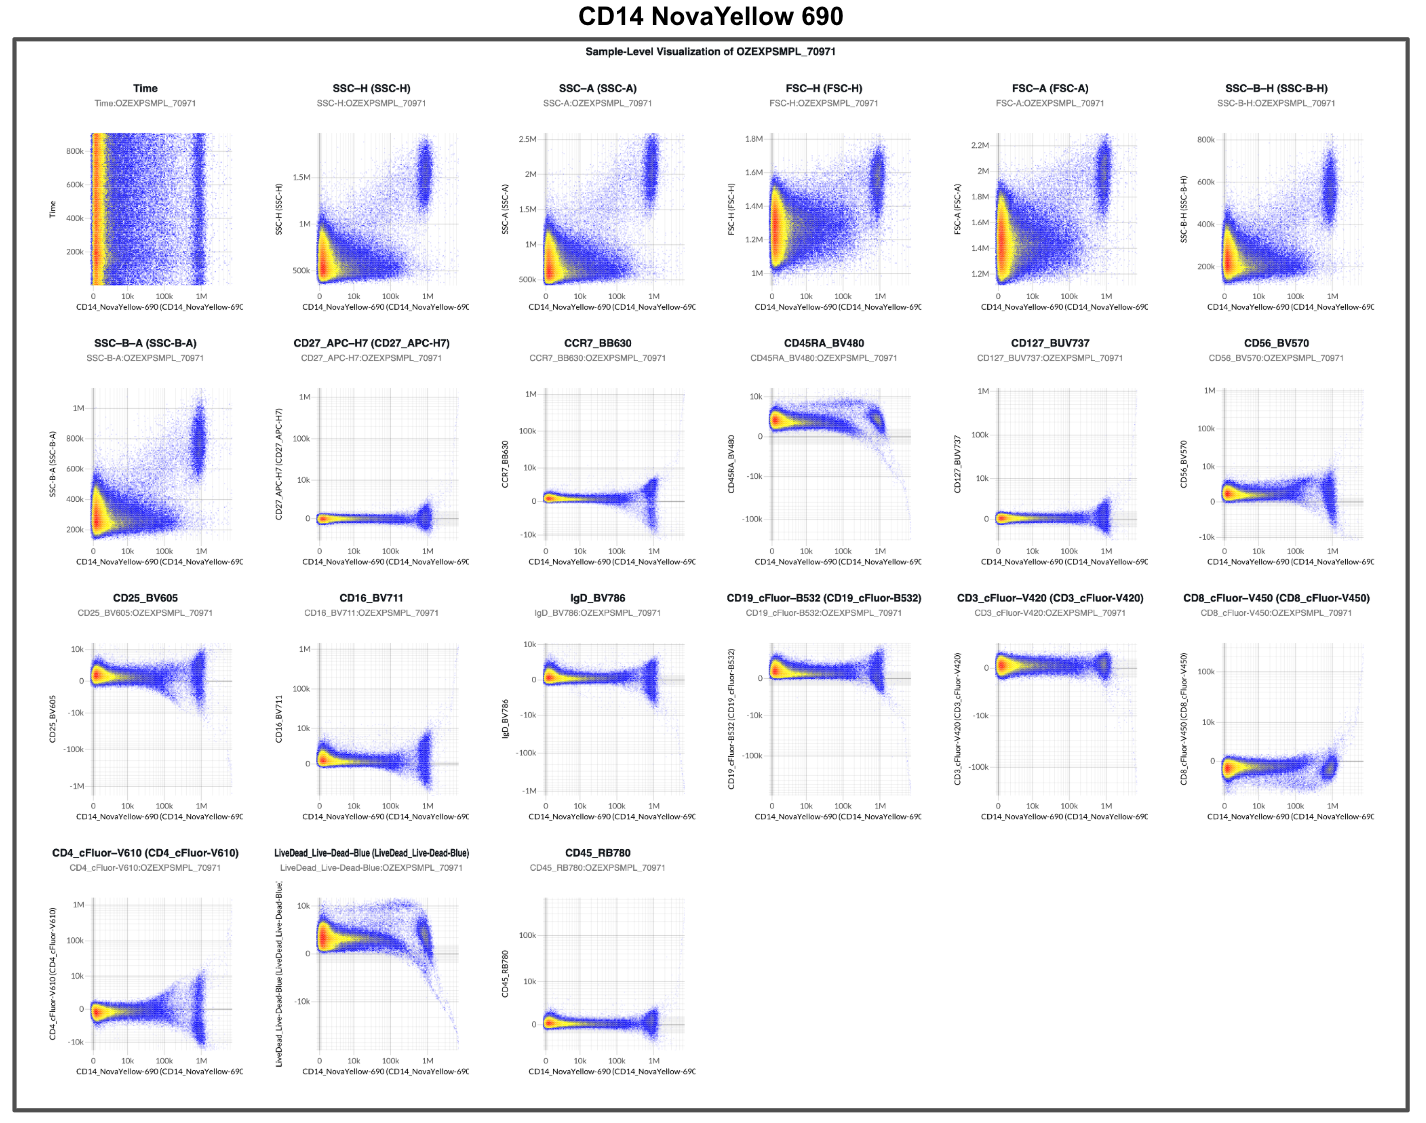
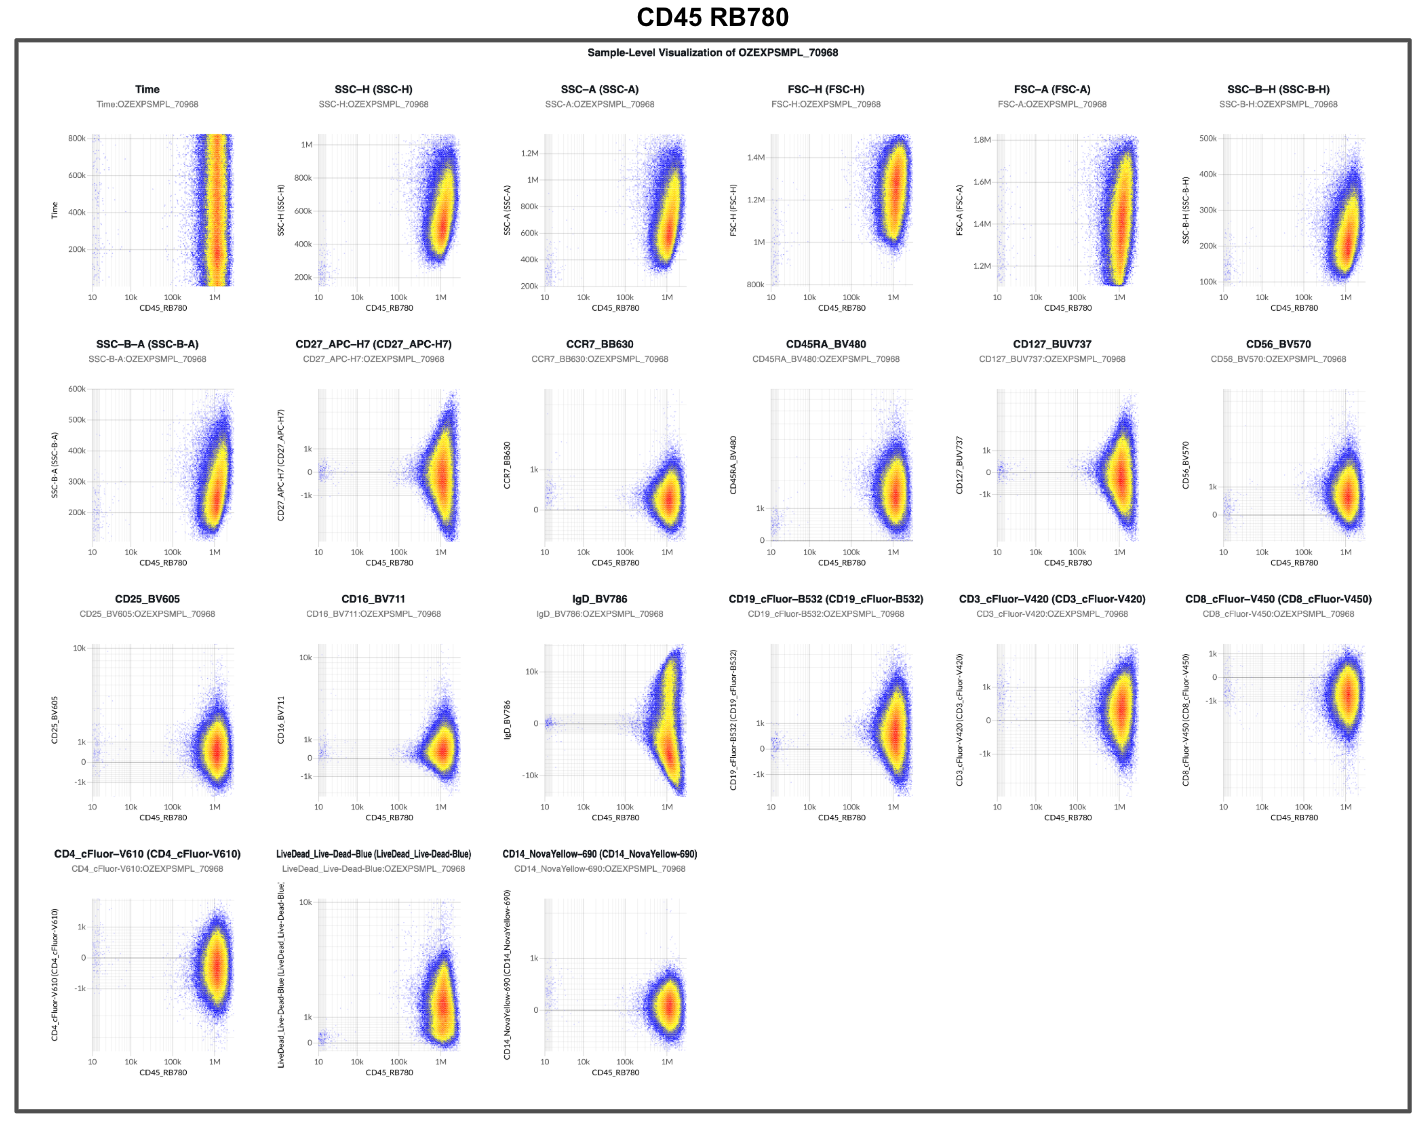
As such, reviewing the unmixed single-color controls should be the first step of cytometry data analysis. In the examples we provided, had either of the analysts reviewed the unmixed single-color control data (Figure 8 and Supplemental Figure 1), both would have reached the same conclusion before gating anything: the unmixing model is wrong.
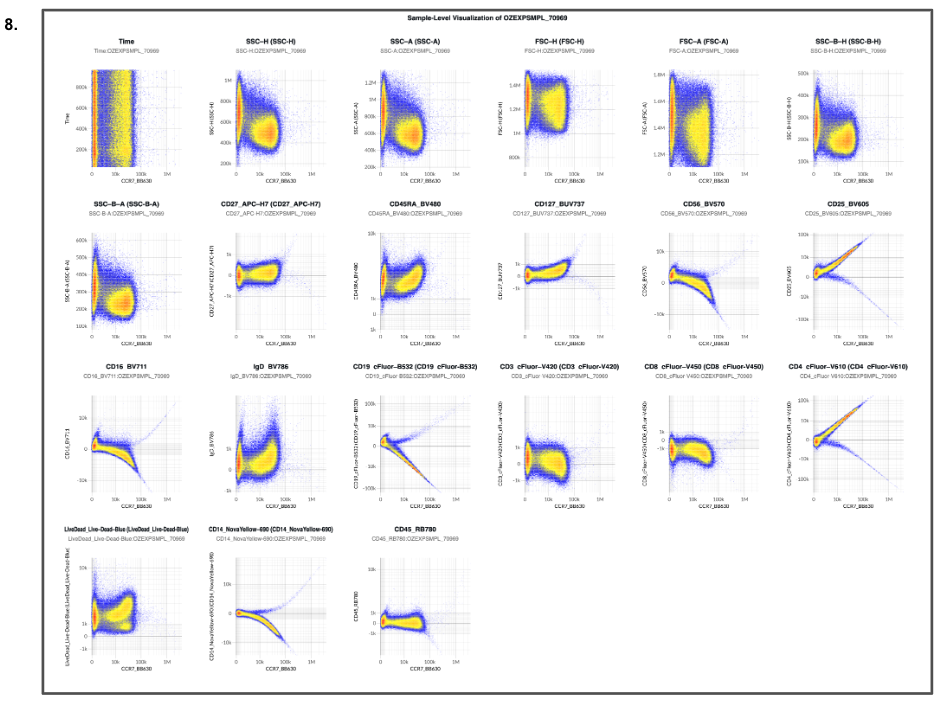
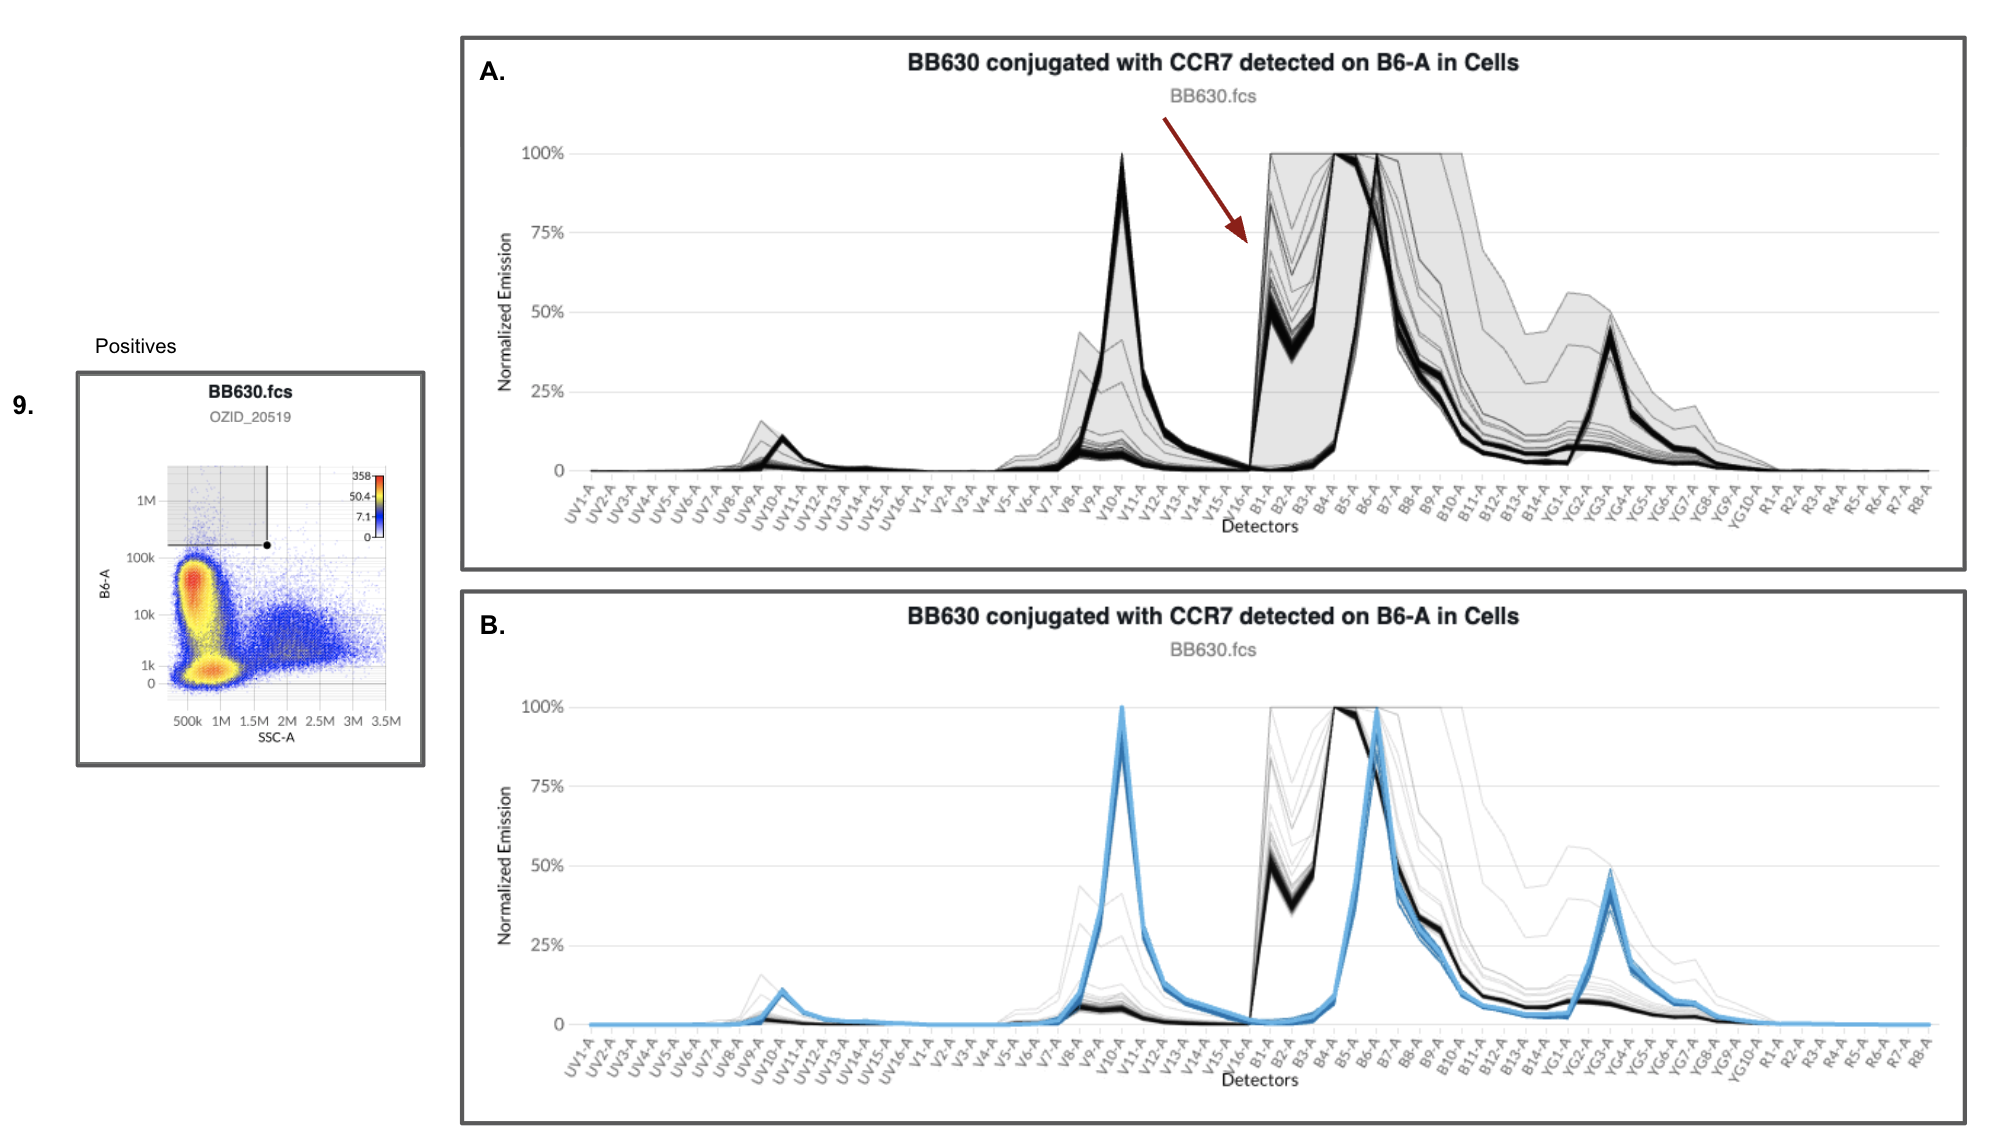
In this case the culprit was a single control. The CCR7-BB630 tube contained contaminating events (Figure 9), and because the BB630 spectrum was estimated by gating bright events on its peak detector (B6-A), those contaminants were averaged into the reference. That is the reference contamination failure mode described at the top of this post. Reviewing the controls catches it, but only if the controls travel with the data.
A Solution: Ship the controls with the data
Every unmixed or compensated dataset should ship as a complete data package: the raw and unmixed experimental files, plus the raw and unmixed control files used to build the model. That holds for every lab that generates cytometry data, whether academic, core, pharma, or CRO, and for anyone who consumes, reviews, relies on, or makes decisions with that data.
Without the controls, unmixed data can’t be verified. When something looks unusual or surprising downstream, there is no way to trace it to its source and no objective path to fixing it. The analyst is left to guess, or to compensate the output until it “looks” right.
In our experience, this breaks down when single-color controls are treated as internal working files rather than part of the deliverable: the sponsor receives unmixed experimental files and a clean PDF of the gating path, and nothing else. Data delivered that way cannot be checked, troubleshot, or re-analyzed. Researchers and sponsors should write raw and unmixed control files into the SOP, SOW, or quality agreement as a required deliverable for every cytometry experiment.
The gap is not confined to any one sector. Many practitioners were never taught to look at their controls after unmixing, and nothing in a typical workflow asks them to. Controls get acquired, used to build the matrix, and forgotten. Reviewing them properly takes time and skill, so under deadline pressure it is a step that often gets skipped. The result is Analyst 1’s outcome: a confident conclusion built on data nobody checked.
We don’t think that should be the norm, and at Ozette it isn’t. Every dataset we generate at our lab and deliver includes the single-color control files alongside the experimental files, and we require the same of every CRO we work with. The Ozette Resolve platform also keeps the controls used to unmix any multicolor files alongside it, so anyone reviewing a result can open those controls and inspect them instead of taking the unmixing on trust. If you generate cytometry data, ship the controls. If you buy it, require them.
Ozette Resolve
Ozette Resolve surfaces this kind of problem at setup, because it puts review of the controls front and center before unmixing begins. Analysts see how each control performs before it enters the model.
With Ozette Resolve’s spectral view we can immediately see that the bright events (Figure 9A) contain a mixture of true positives and contaminating events. We can use the spectral similarity search or fluorophore database match tool within Ozette Resolve to only include the true positive events in the spectral estimates for BB630 (Figure 9B). That removes the contaminants from the reference, recovers the control, and yields a correct unmixing.
To learn more about the Ozette Resolve workflow we encourage readers to review our prior blog post on filtering out contaminants from single-stain controls.
Concluding remarks
Two analysts, one dataset, the same incorrect unmixing, opposite conclusions. Cytometry data are multivariate, but we often review them two parameters at a time, so unmixing errors hide in whichever plots we didn’t draw. Analyst 1’s gating decisions used only 8 parameters from a 15-marker panel. A conclusion that depends on the gating path isn’t a conclusion. Three things we can all do to avoid this problem: review unmixed single-color controls before gating anything, deliver raw and unmixed controls with every dataset, and fix the controls rather than compensating the output.
Appendix
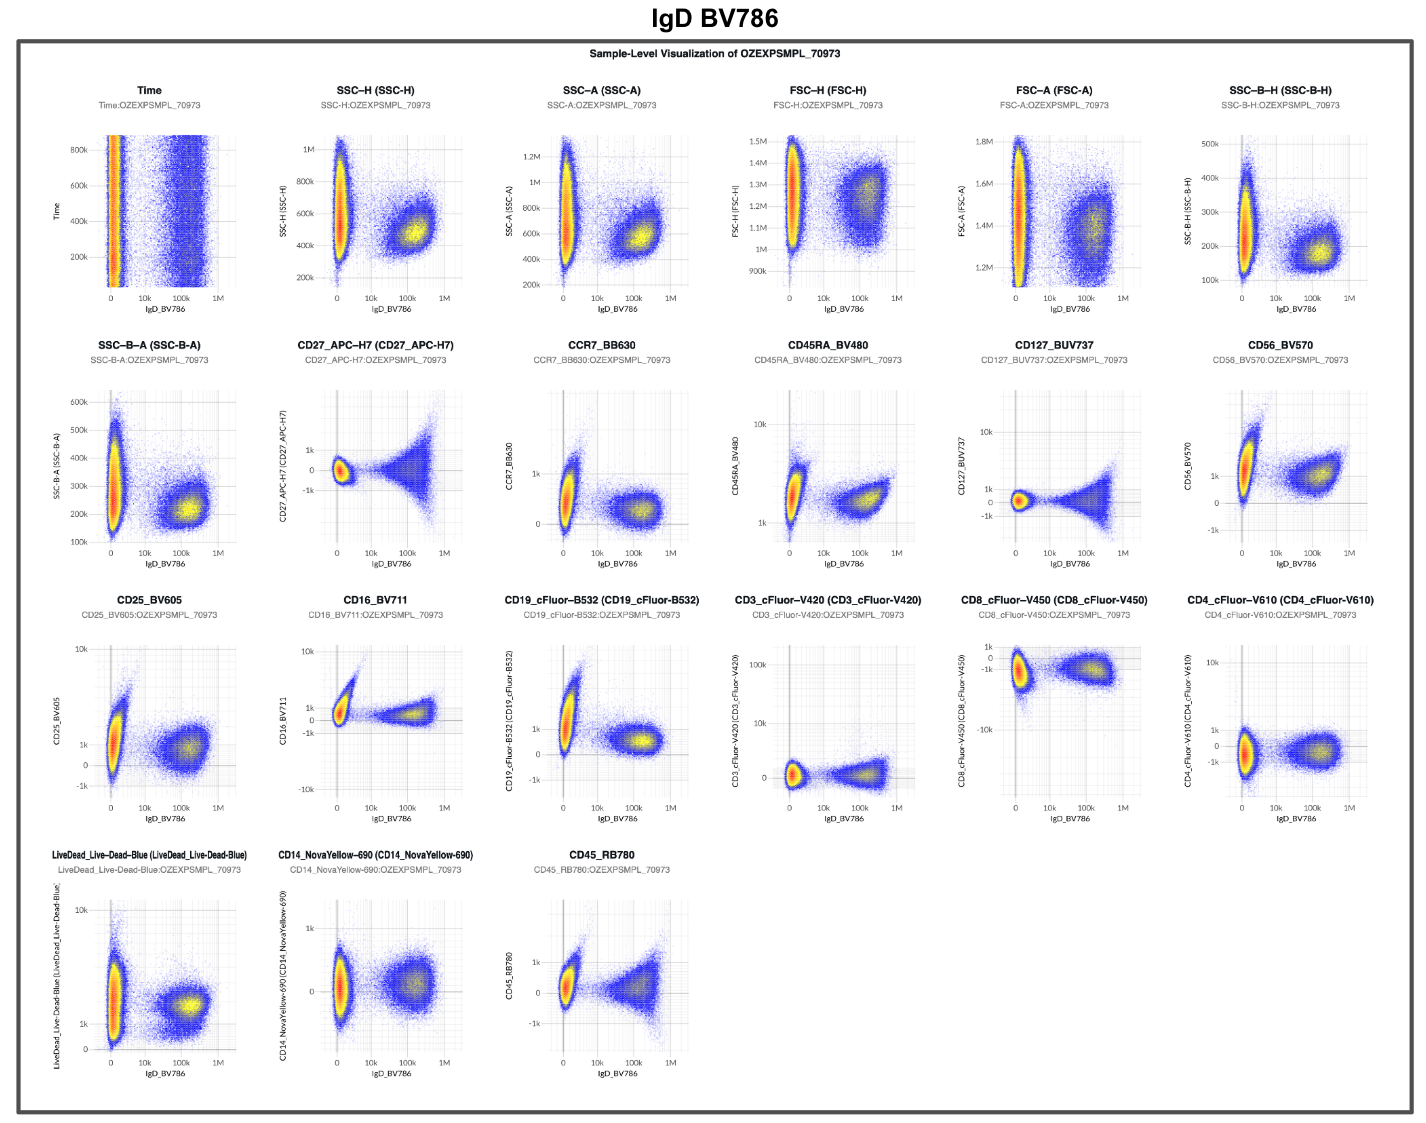
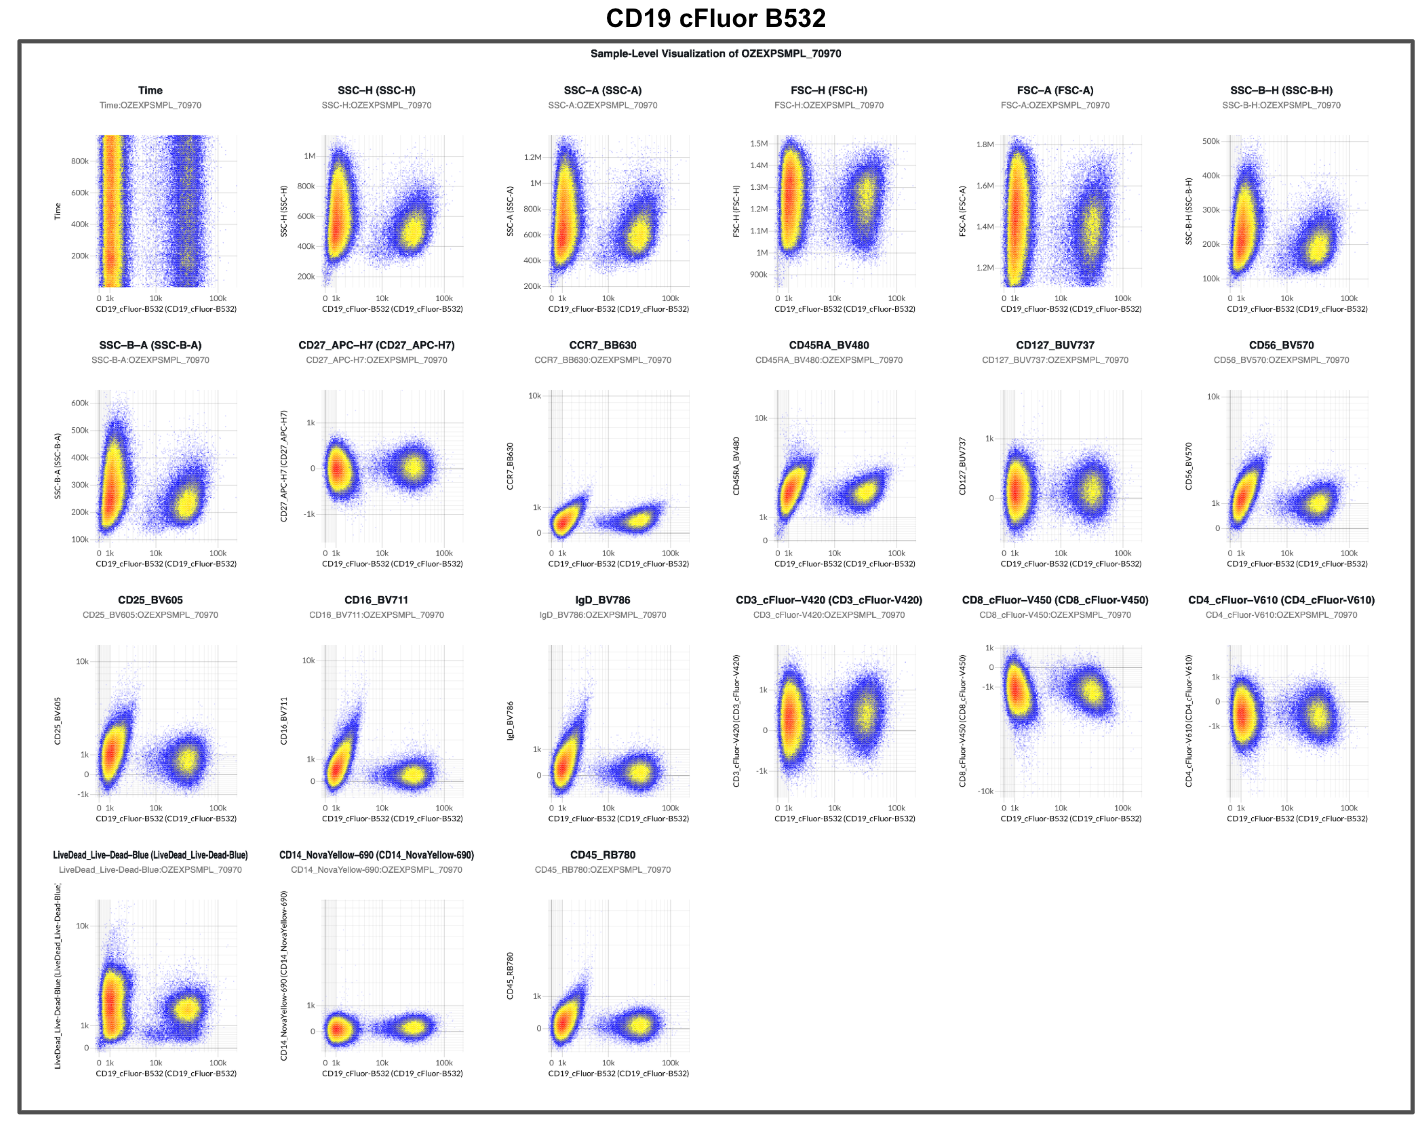
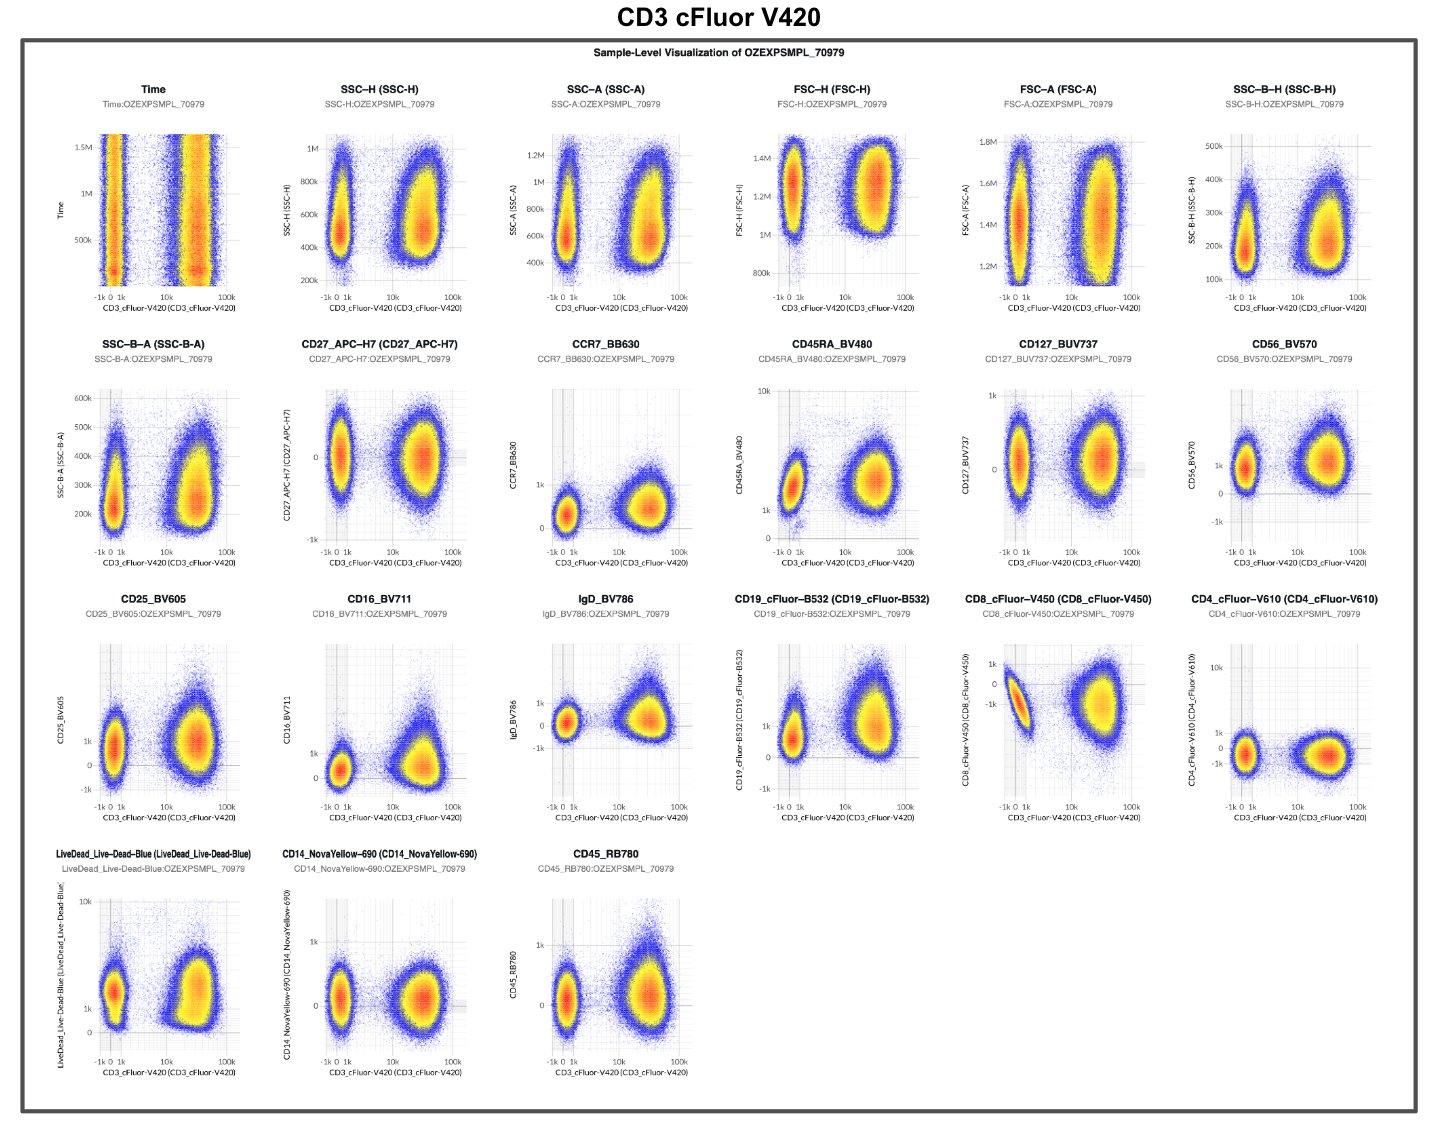
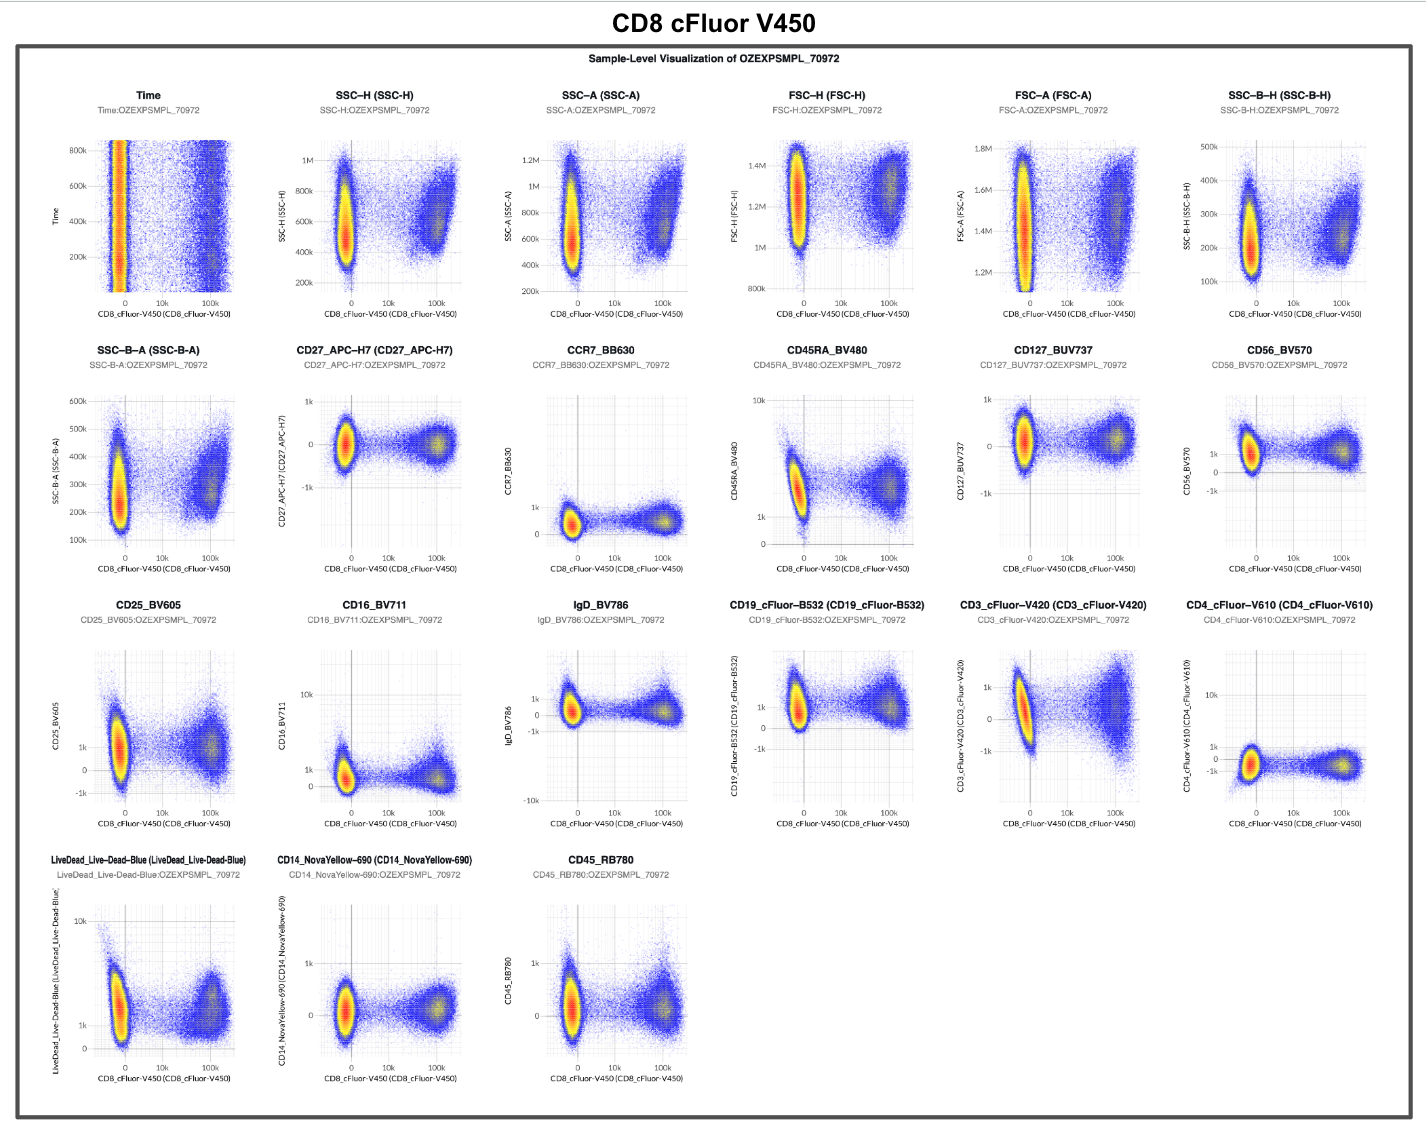
Supplemental Figure 1. 1 × N plots for the unmixed single-color controls. Only BB630 had a poor spectral estimate due to failure to remove contaminating events (Figure 9). Each plot is derived from 1 single-color control with X axis fixed to the fluorophore defined by that single-color control. The title of the plots indicates the identity of the single-color control and the X axis. The single-color controls were unmixed using Ordinary Least Squares (OLS). Global Autofluorescence (median AF) was estimated using an unstained PBMC sample for background correction in single-color controls. Unmixing errors are outlined with a red box in the plot for the CCR7 BB630 single-color control.
References
Nguyen, R., Perfetto, S., Mahnke, Y.D., Chattopadhyay, P. and Roederer, M. (2013), Quantifying spillover spreading for comparing instrument performance and aiding in multicolor panel design. Cytometry, 83A: 306-315. https://doi.org/10.1002/cyto.a.22251
← All posts