Claude Science on Ozette, part two: reproducing and extending two published findings
In July we put Claude Science on top of Ozette. We connected it to the platform through our MCP server and pointed it at two existing studies: a tuberculosis cohort and a melanoma immunotherapy dataset. That first post was an early demonstration, run on a development copy of the data, meaning the dataset was not processed through our production workflows.
We've since run both studies on Ozette's production platform, with an improved MCP server, and the agent went further than the first time.
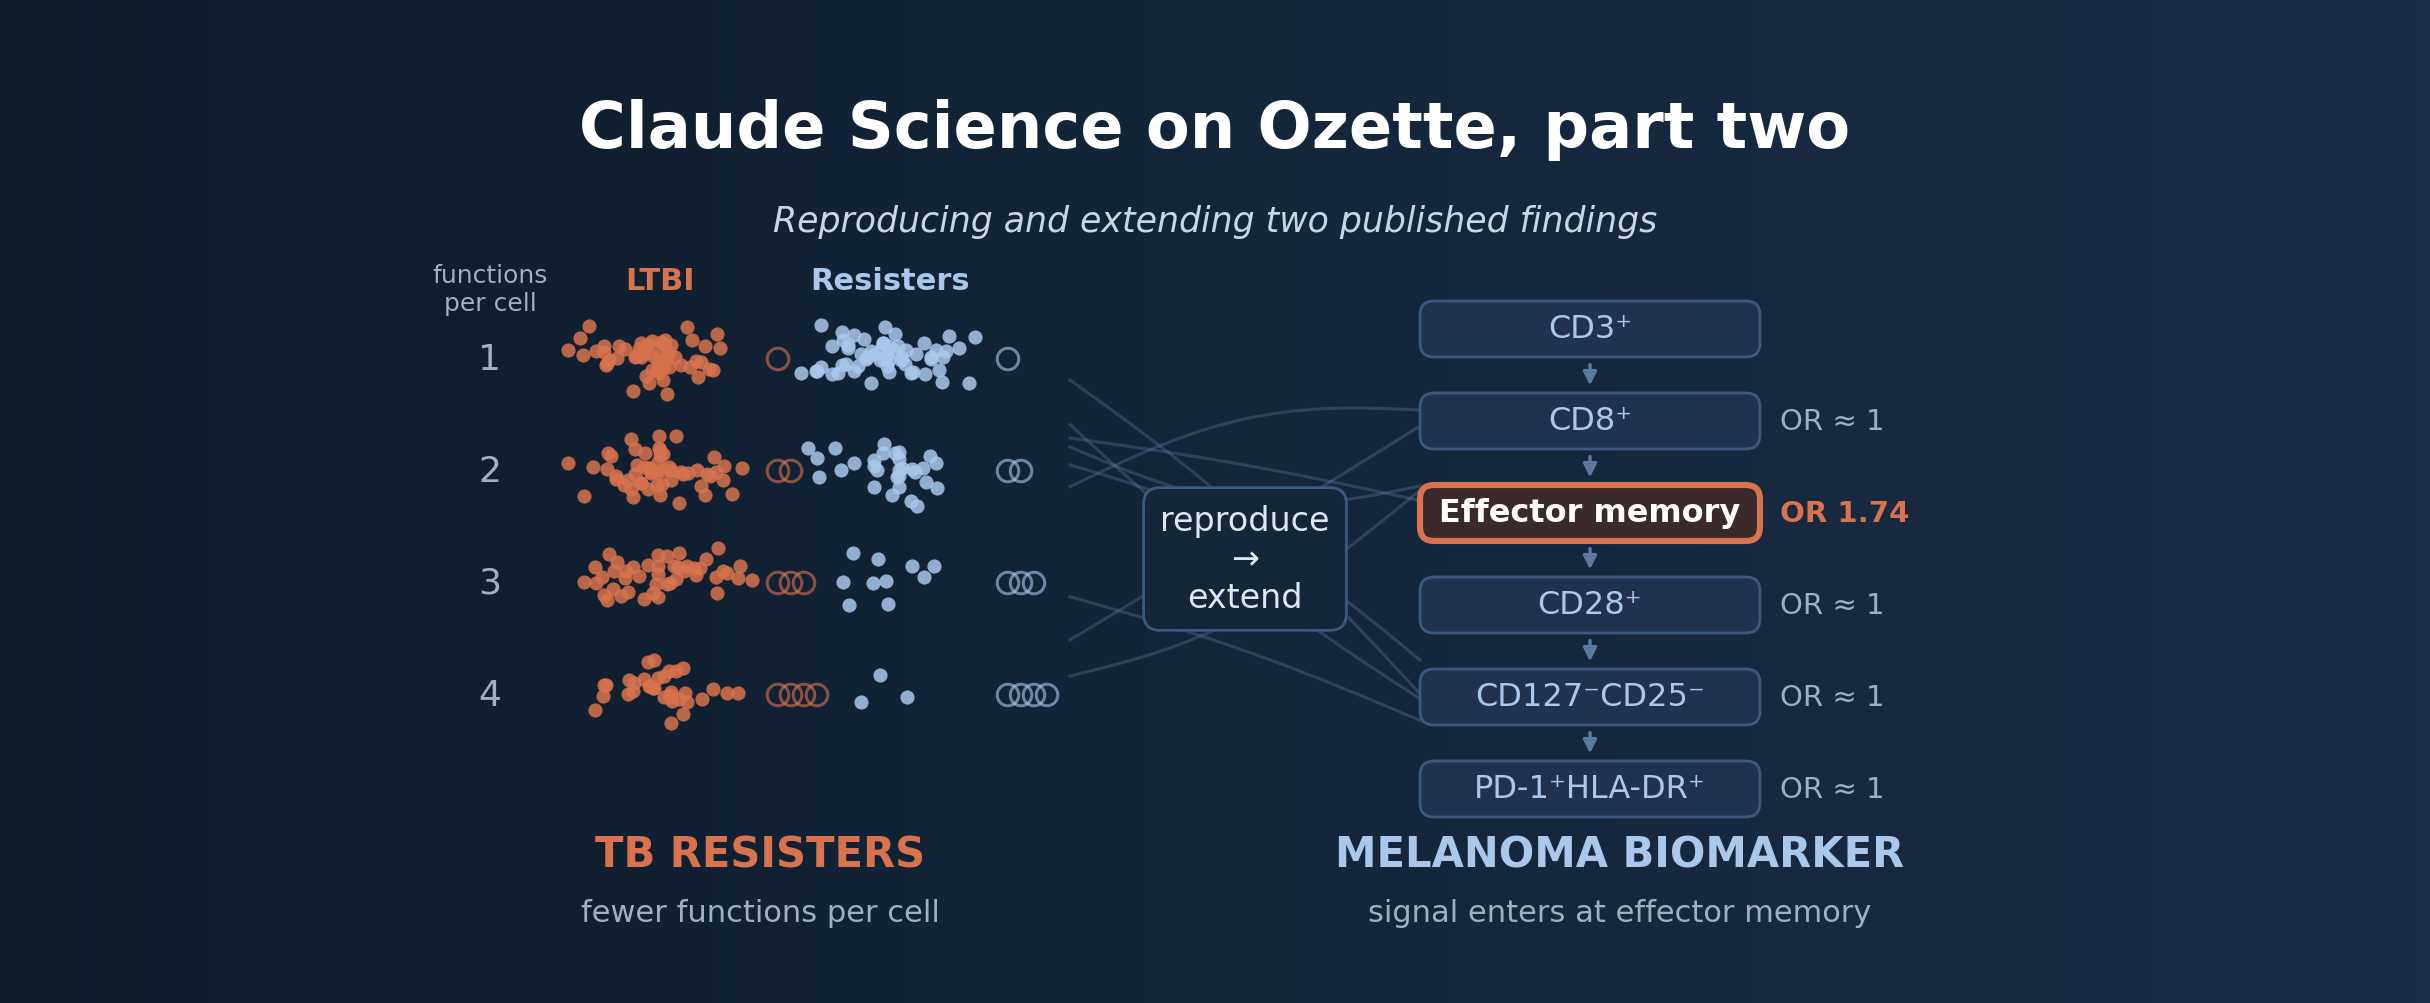
In the TB cohort, it reproduced the IFN-γ-independent CD4 T-cell signature of people who resist TB infection, found that only CD4 T cells separate them from latently infected people, and showed that resisters' responses carry fewer functions per cell.
In the melanoma cohort, it reproduced a published biomarker test of anti-PD-1 response exactly, down to the p-value. Then it took the biomarker apart and showed that in this dataset the signal comes from a broader expansion of CD8 effector-memory T cells, not just the specific subset the biomarker describes.
A few findings from the first post change as a result. They're summarized at the end.
Here's what the agent works with. Starting from raw FCS files, with no manual gating, Ozette processes every sample (standardization, preprocessing, quality control and calibration, then Discovery) into high-quality data in which every cell is annotated, marker by marker, and tied to the study design. Through our MCP server, the agent gets the context it needs to reason over that data directly: the studies it's allowed to see, their sample metadata, Ozette Discovery phenotypes, and per-cell annotations it can count in any combination. A scientist can then ask the agent to identify signals in the data that answer questions of interest. Using the MCP connection, the agent can fit statistical models against immunological subsets paired with clinical metadata to answer these questions. In this post, we'll describe two case studies where a scientific driver pairs with an agent supported by the Ozette platform to get insights from their data.
The TB resister cohort
Some household contacts of people with active tuberculosis never test positive for TB infection, even after years of exposure. Their tuberculin skin test (TST) stays negative, and so does their interferon-γ release assay (IGRA), which measures T-cell IFN-γ production in response to TB-specific antigens. Are they uninfected, or responding in a way the tests don't measure?
Lu et al. (Nature Medicine, 2019) studied these "resisters" (RSTR) alongside latently infected controls (LTBI) and found that resisters do respond: they carry antibodies to TB antigens, and CD4 T cells that respond to the IGRA's own antigens by making CD154 (CD40L), IL-2 and TNF without IFN-γ. Ozette holds the intracellular cytokine staining data from that cohort: 42 subjects (22 resisters, 20 LTBI) and 205 samples across five conditions. Those are unstimulated, M. tuberculosis whole-cell lysate, two peptide pools, and SEB as the polyclonal positive control. We asked the agent to investigate the response described in the paper.
The platform records the peptide pools only as "Pool 1" and "Pool 2." The agent identified them from the paper as ESAT6/CFP10, the TB-specific antigens the IGRA uses, and Ag85A/Ag85B/TB10.4, then confirmed which was which from the data: resisters make no IFN-γ in response to Pool 1, as their clinical definition requires.
Checking the assay
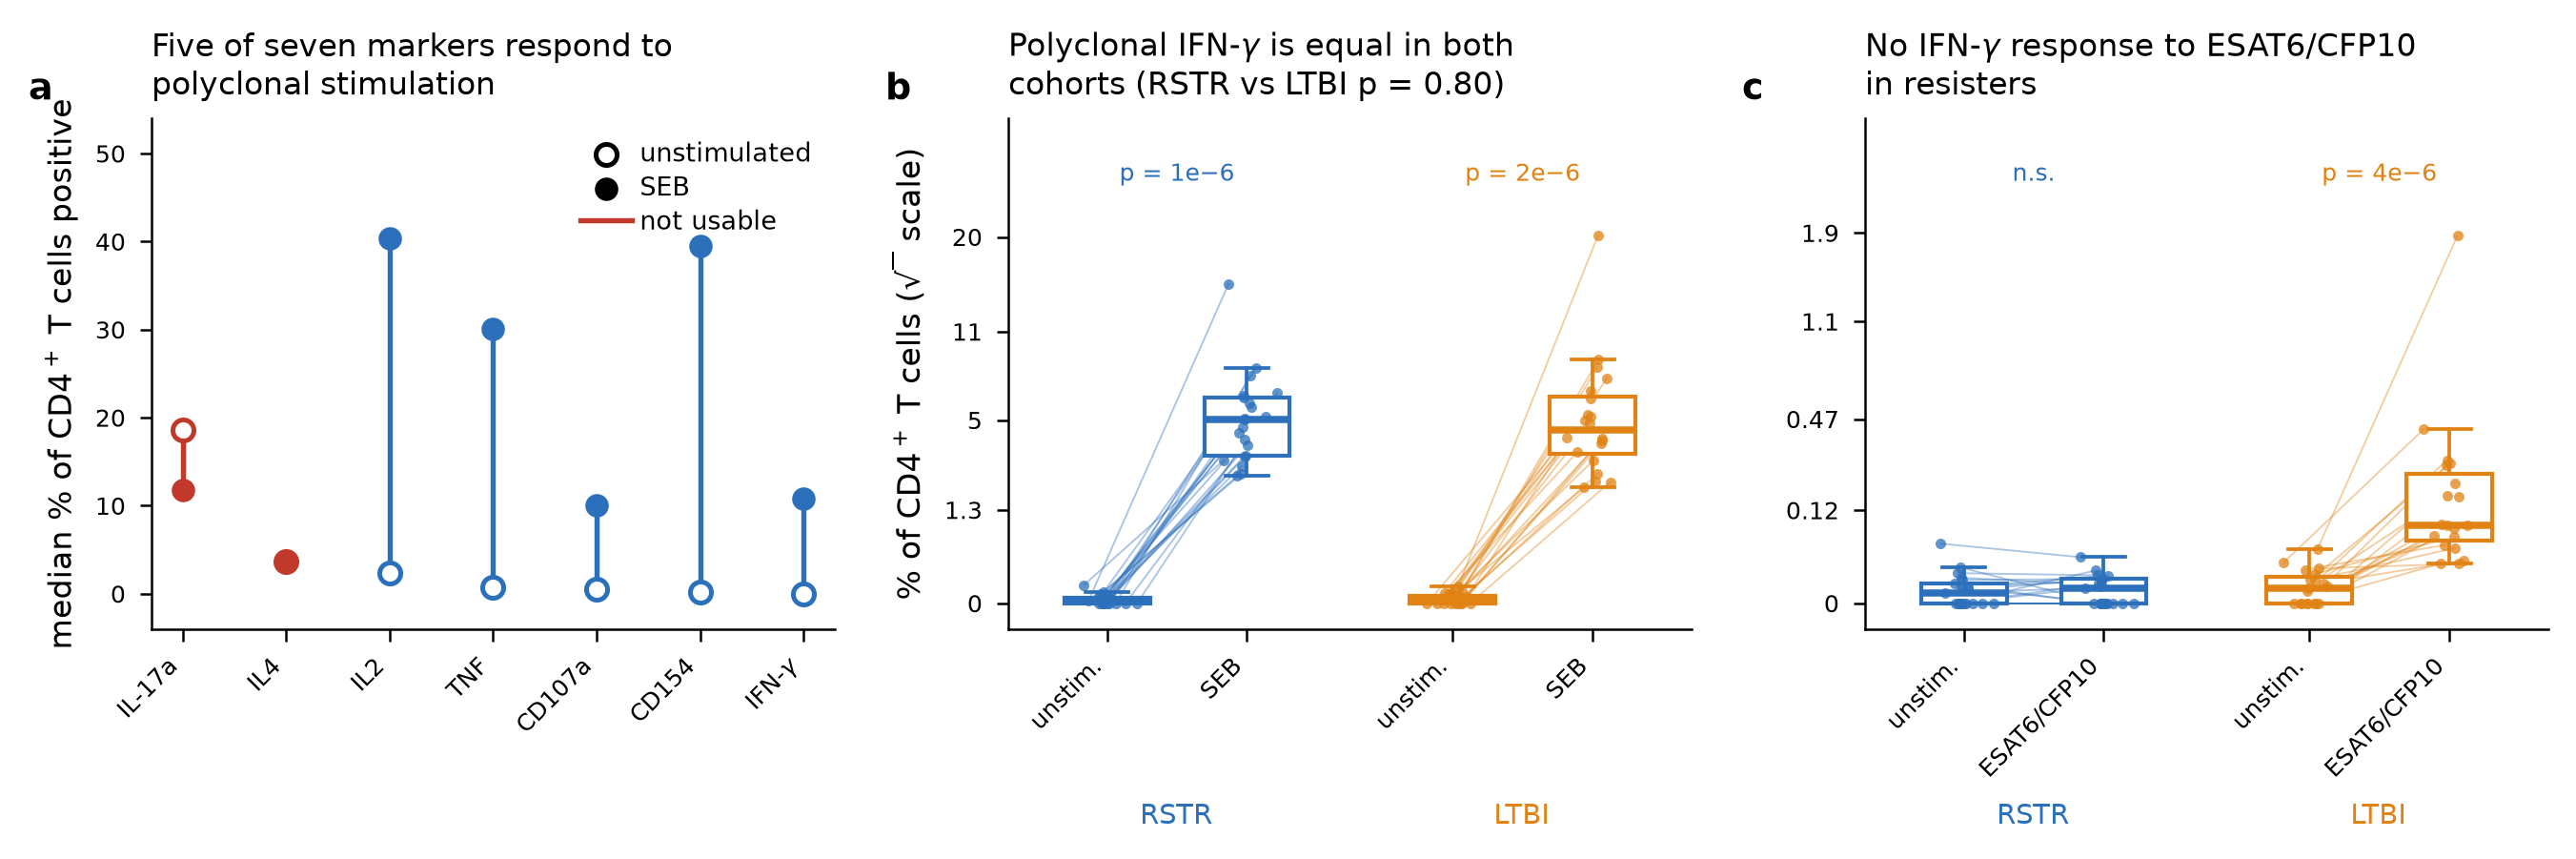
Before testing anything, the agent calibrated each functional marker against SEB: a usable marker is low without stimulation and rises under SEB. In CD4 T cells, five of seven meet this criterion: IFN-γ, CD154, CD107a, TNF and IL-2. IL-17a starts high and falls under stimulation, and IL-4 doesn't respond, so both were set aside, leaving 2⁵ = 32 functional subsets per T-cell compartment. Including IL-17a and IL-4 in tests for difference in response changes nothing: every polyfunctional combination that separates the RSTR and LTBI cohorts reduces to a five-marker subset. SEB induces a similar IFN-γ response in both cohorts (p = 0.80), so there's no sign of a global Th1 defect in either group.
The agent also found that IL-17a reads differently by acquisition batch: 48% of unstimulated CD4 cells in one batch against 5.2% in the other. Each batch is balanced by cohort, and every significant cohort result below holds when cohort labels are permuted within batch.
Reproducing the paper's four subsets
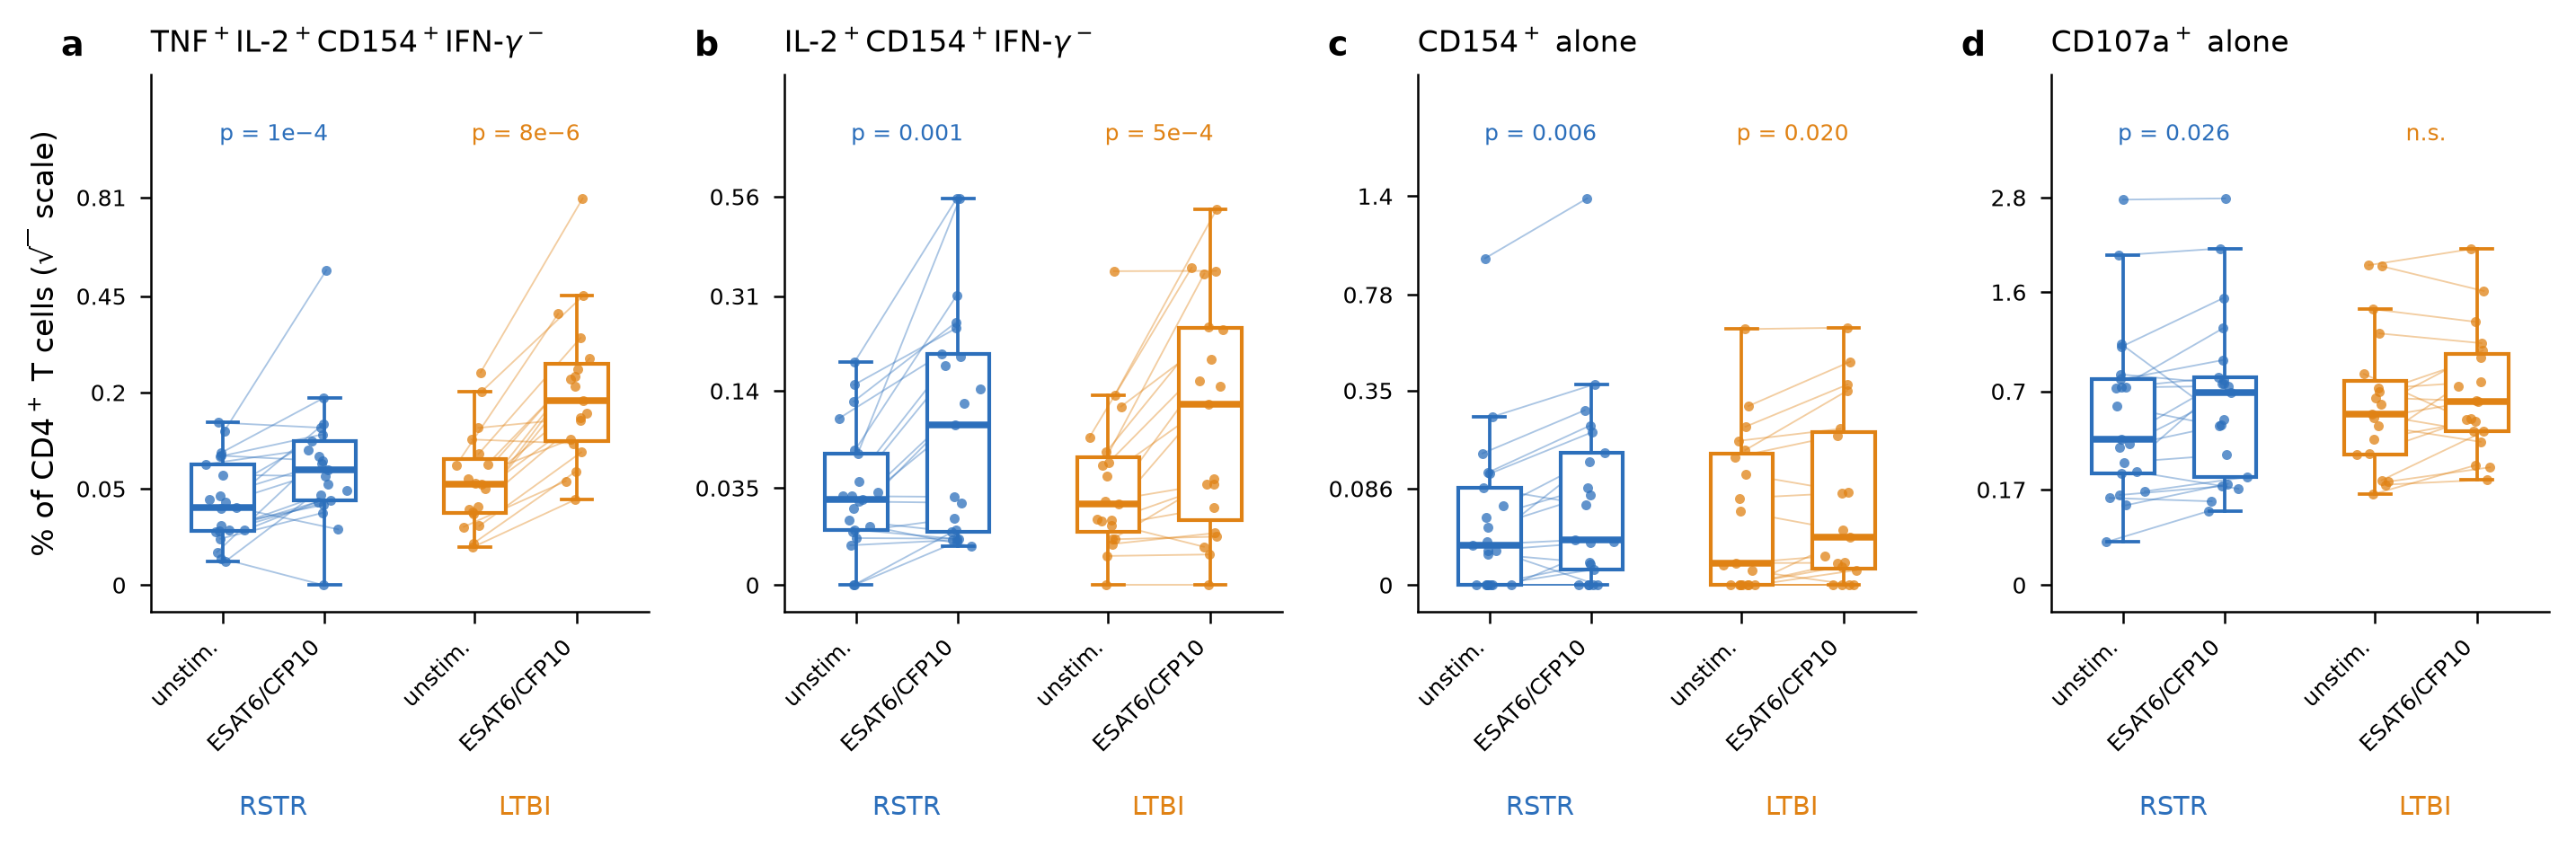
The paper names four IFN-γ-negative CD4 subsets that resisters mount against ESAT6/CFP10. Using the Ozette platform, the agent reconstructed each one and tested it against the same subject's unstimulated sample, in resisters alone (21 with paired samples):
| CD4 subset (from the paper) | Median response, % of CD4 | p (paired, resisters only) |
|---|---|---|
| TNF⁺IL-2⁺CD154⁺IFN-γ⁻ | 0.0281 | 1.3 × 10⁻⁴ |
| IL-2⁺CD154⁺IFN-γ⁻ | 0.0734 | 1.0 × 10⁻³ |
| CD154⁺ alone | 0.0052 | 5.6 × 10⁻³ |
| CD107a⁺ alone | 0.0671 | 0.026 |
All four are significant. None of the 16 IFN-γ⁺ combinations responds; the largest median is 0.0004% of CD4 cells. Resisters respond to the IGRA antigens, just not with IFN-γ. That second half is expected, since resisters are selected for a negative IFN-γ test to these same antigens. The concordance of the four IFN-γ-negative responses with the selection criteria provides evidence the agent reproduced real signals in these data.
The paper identified its subsets with COMPASS, a Bayesian model of antigen-specific cytokine combinations. The agent counted the same combinations from Discovery's per-cell annotations and tested them with paired rank tests. Using this alternative analysis route, the agent found the same subsets responded in the same direction as the subsets described in the paper.
CD4 versus CD8
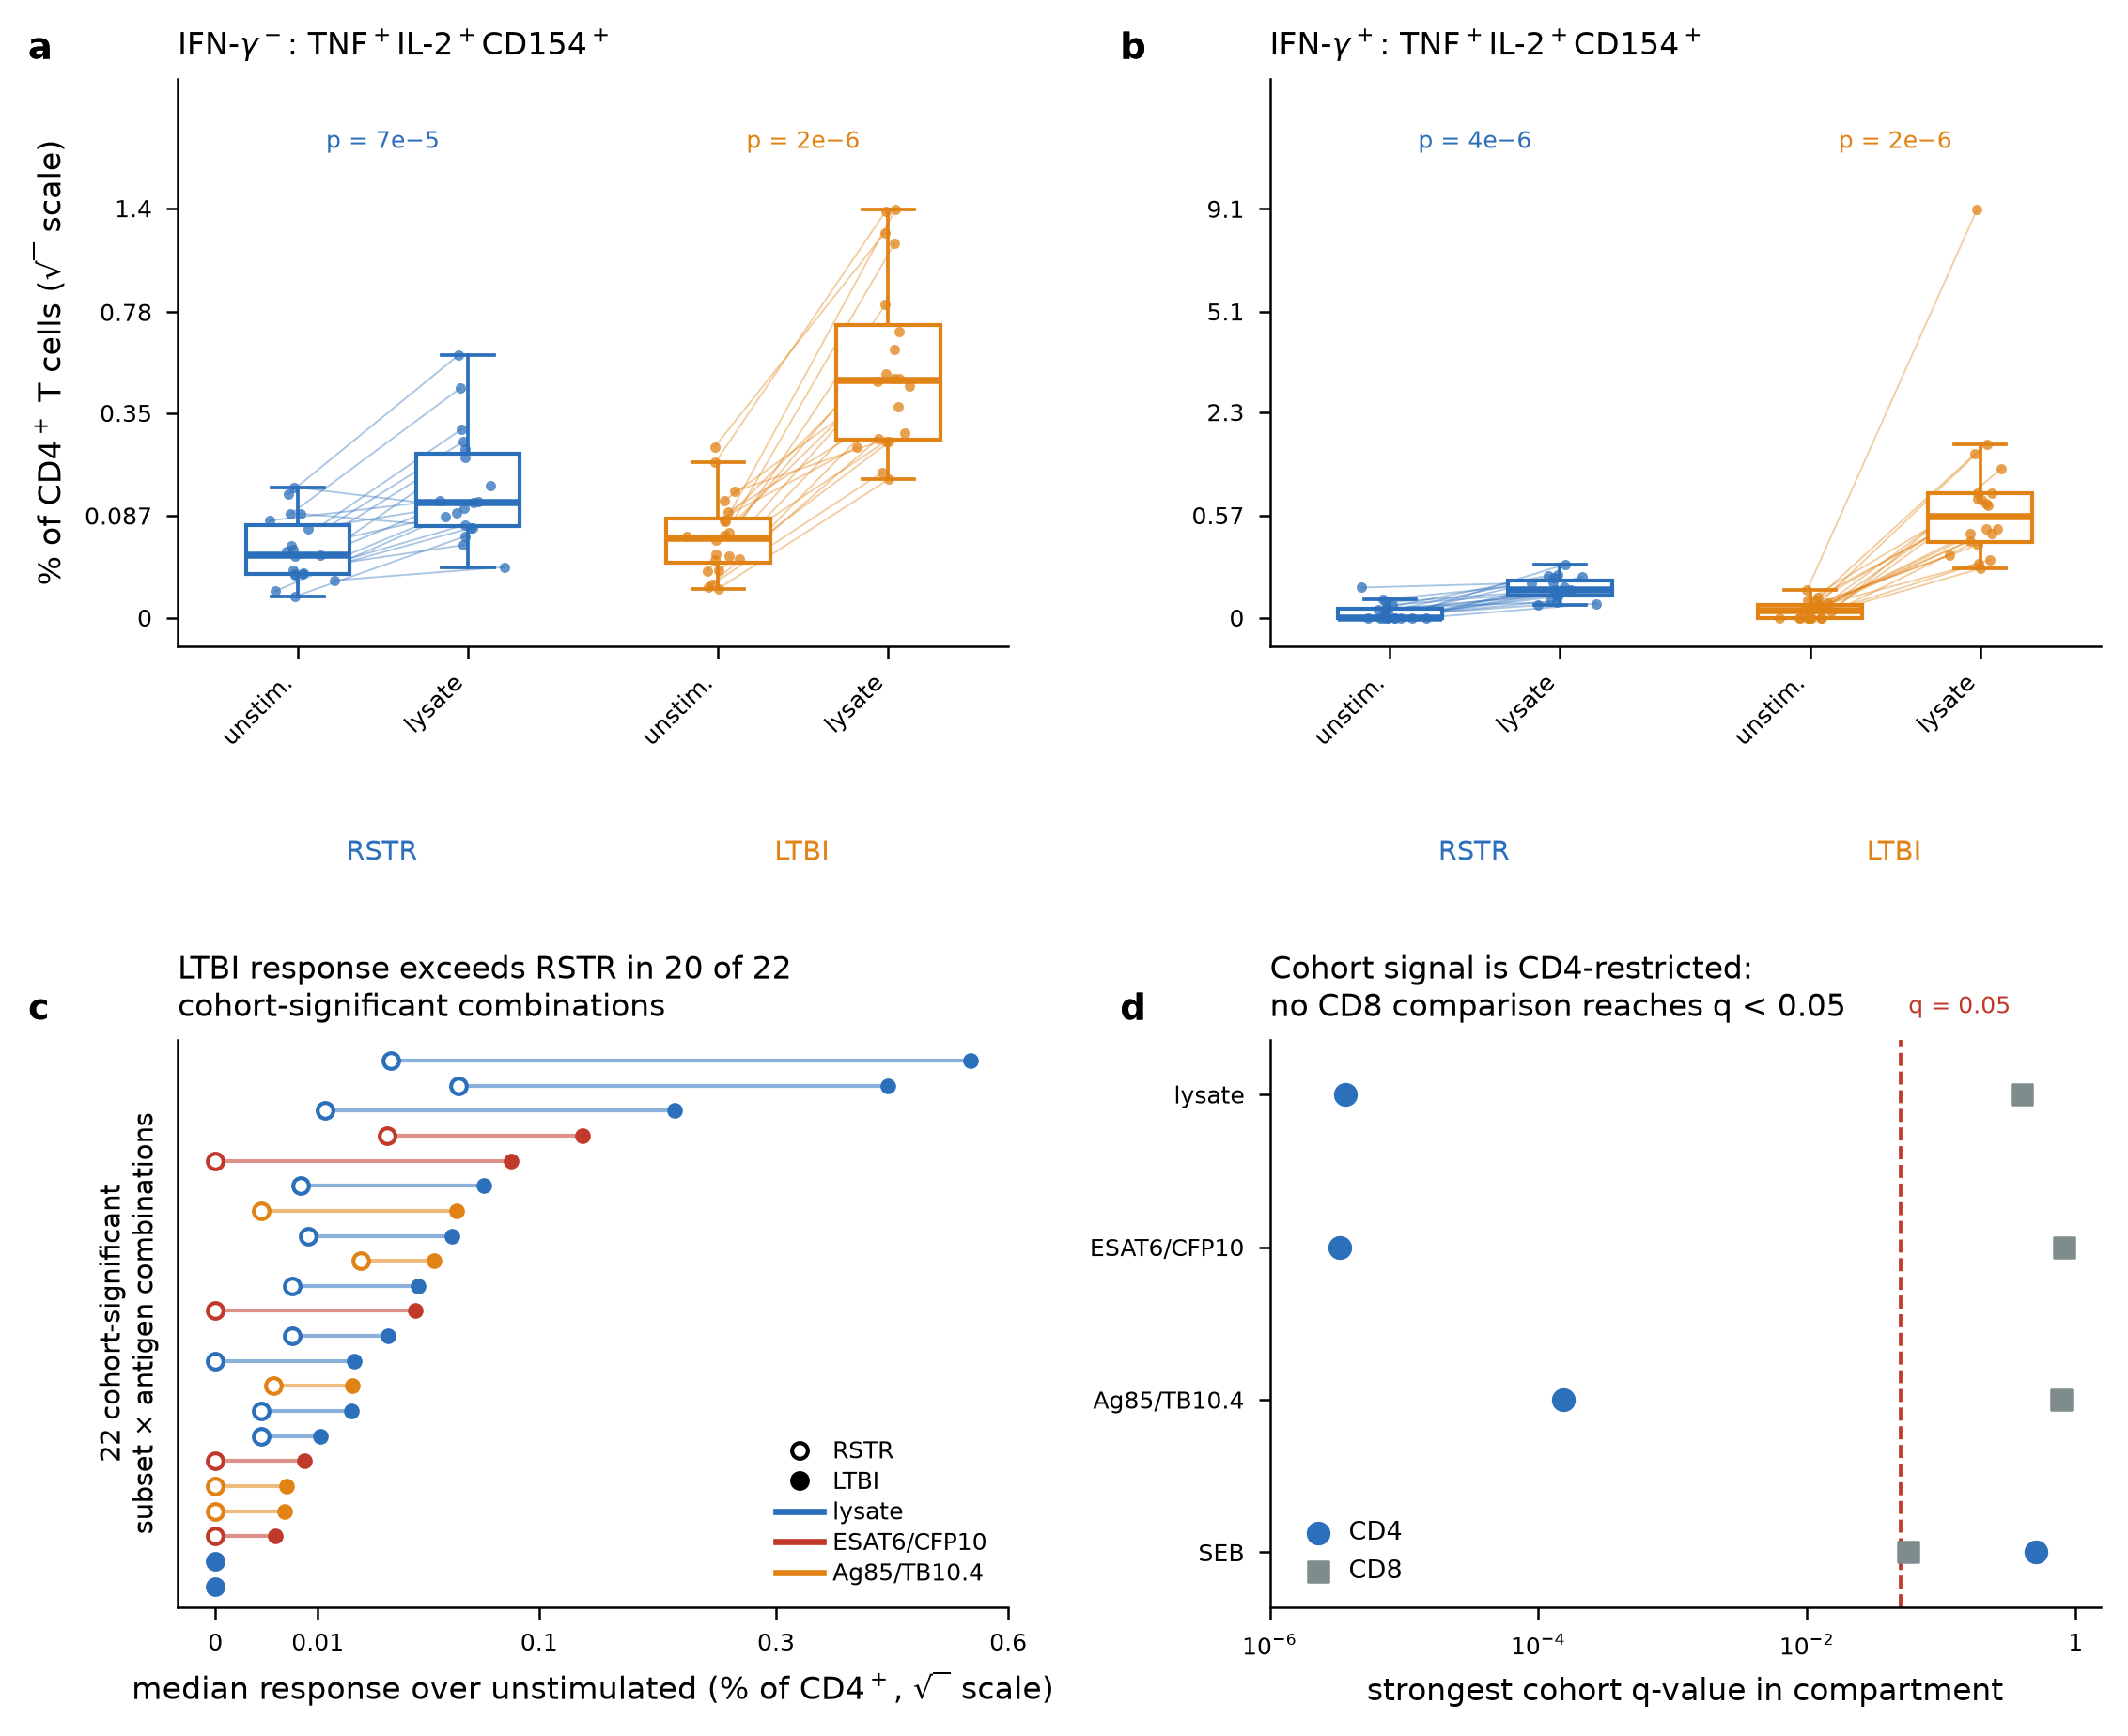
Both T-cell compartments respond to TB antigens. With lysate, 30 of 32 CD4 subsets and 6 of 32 CD8 subsets rise significantly. But only CD4 separates the cohorts. Across every subset and antigen, 22 comparisons reach cohort-level significance (Benjamini–Hochberg q < 0.05), and all 22 are CD4. LTBI carries the larger response in 20 of them, and TNF appears in 20. The strongest CD4 cohort signal reaches q ≤ 1.5 × 10⁻⁴ against every TB antigen, while no CD8 comparison crosses q = 0.05. SEB separates the cohorts in neither compartment.
CD8 T cells do respond. CD8 IFN-γ⁺ cells rise with lysate in 31 of 39 subjects (p = 8.8 × 10⁻⁵), with no difference between the cohorts (p = 0.75). CD154, which Lu et al. used to mark antigen-specific CD4 cells, behaves exactly as it should: CD154⁺ CD4 cells rise with lysate in 38 of 39 subjects (p = 7.3 × 10⁻¹²) and separate the cohorts (p = 3.4 × 10⁻⁷), while CD154 is essentially absent from CD8 T cells (0.44% even under SEB). At the level of cell types, polyfunctional Th1 cells rise with lysate in all 39 subjects, 10 times more in LTBI than in resisters. Polyfunctional Tc1 cells respond too, with no cohort difference.
Fewer functions per cell
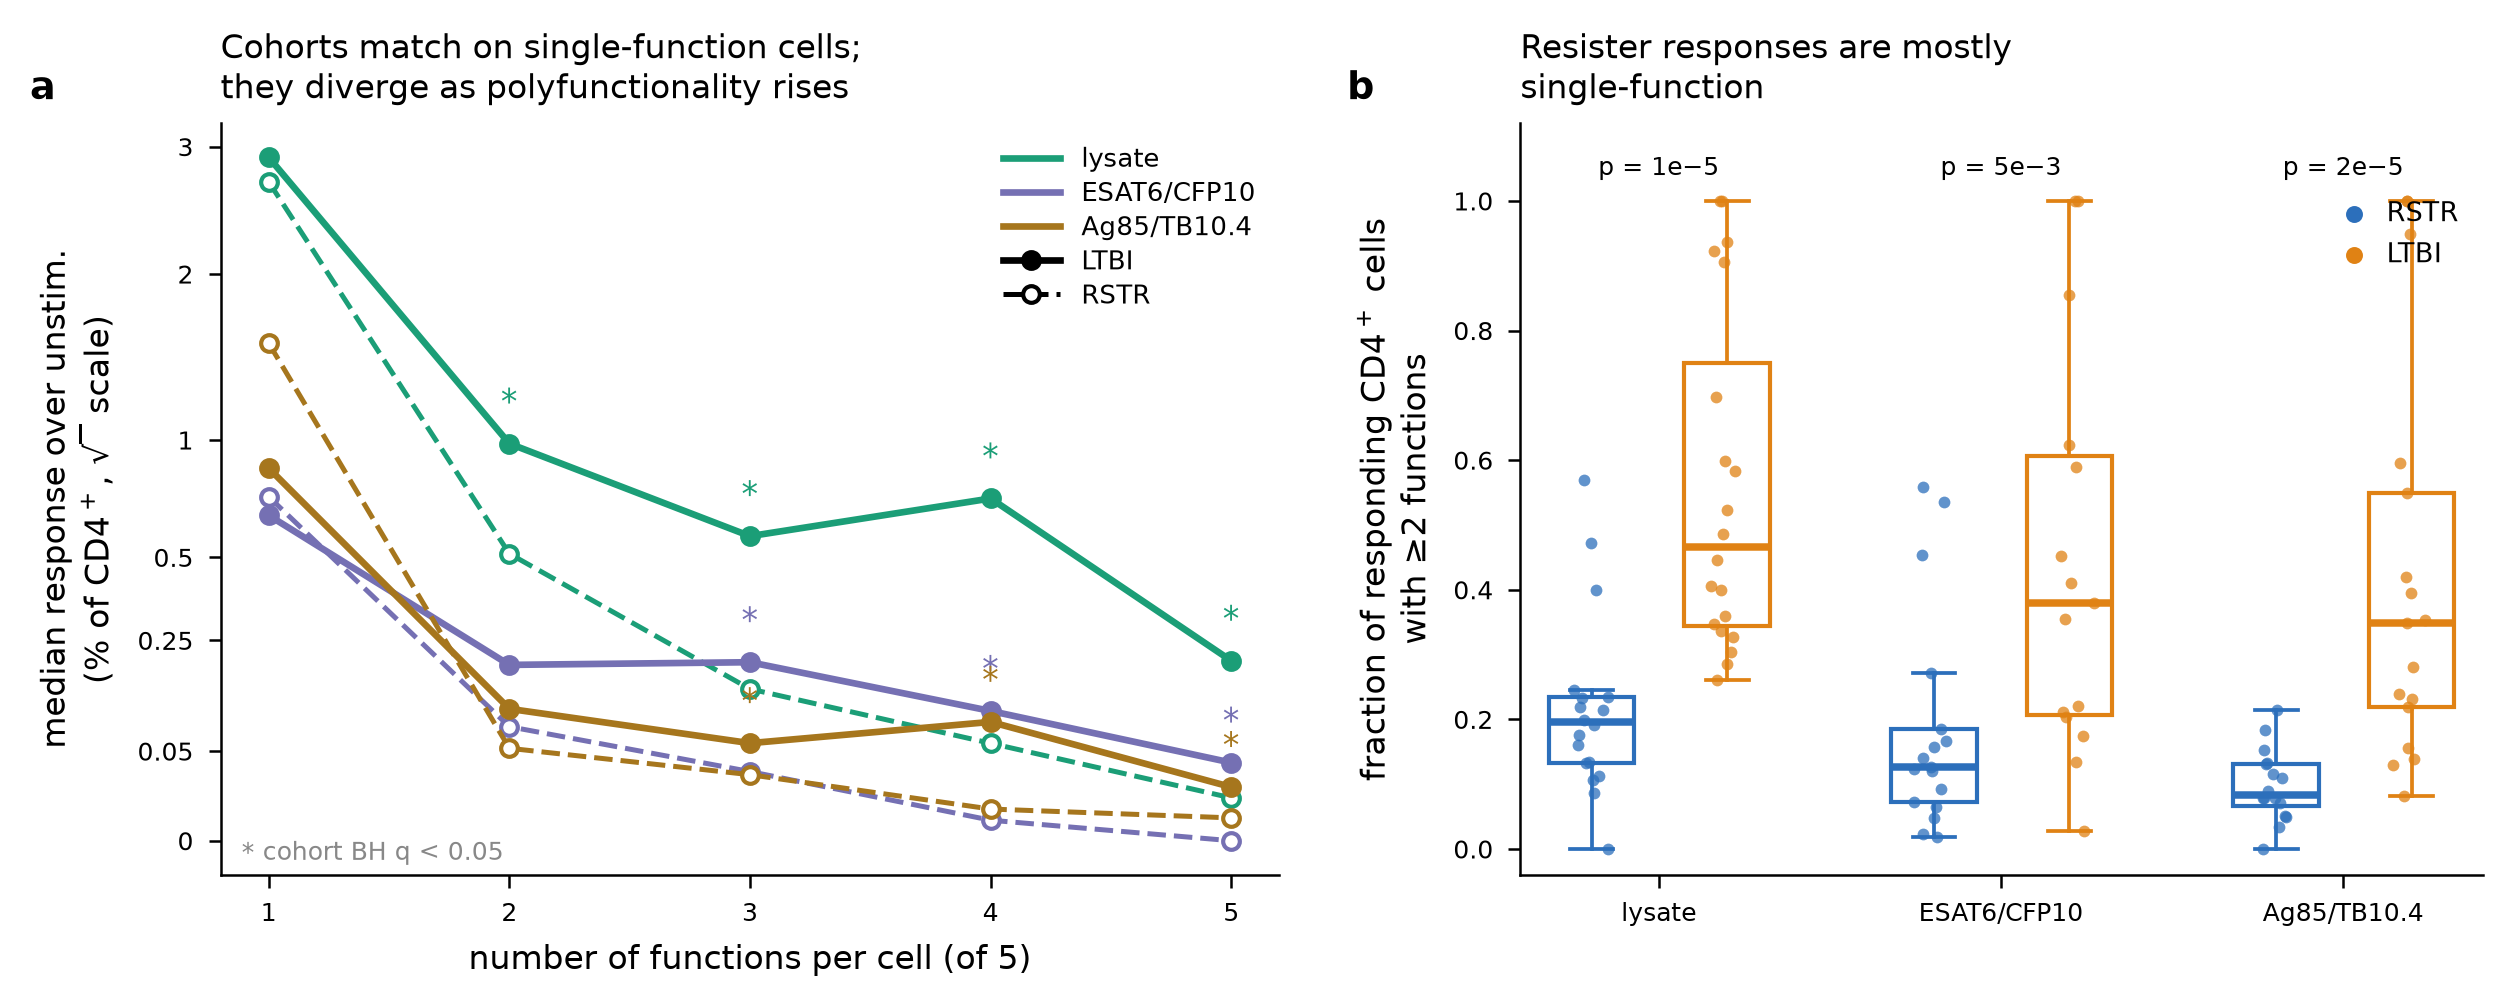
Grouping the responding CD4 cells by how many functions each one carries separates two things: how many cells respond, and how many functions each responding cell has.
Single-function responses don't differ between the cohorts for any antigen. Differences emerge as cells carry more functions: from three functions up, LTBI responses are significantly larger for every antigen, and at four functions they are 12 to 40 times larger than resister responses. For the two peptide pools, the total number of responding cells doesn't differ between cohorts (p = 0.12 for ESAT6/CFP10, p = 0.63 for Ag85/TB10.4). For lysate, the total differs only because of the polyfunctional cells. Among subjects with a measurable response, a median of 20% of a resister's lysate-responding CD4 cells carry two or more functions, against 47% in LTBI (p = 1.1 × 10⁻⁵). The same pattern holds for both peptide pools.
Lu et al. describe resister responses as smaller than those in latent infection, with a lower COMPASS polyfunctionality score that they attribute to the absence of IFN-γ. These data point to something more specific: resisters' single-function responses don't differ from those in latent infection, but they carry far fewer polyfunctional cells. The signal doesn't depend on fine-grained phenotypes, either. Simple two- and three-marker readouts carry it too, and 77 of the 78 tested separate the cohorts. After lysate stimulation, for example, CD154⁺TNF⁺ CD4 cells rise by 0.25% of CD4 in resisters and by 1.57% in LTBI.
A melanoma immunotherapy biomarker
Greene et al. (Patterns, 2021) found a CD8 effector-memory T-cell phenotype, CD28⁺, HLA-DR⁺ and PD-1⁺, associated with anti-PD-1 response in a Merkel cell carcinoma flow cytometry trial. They then re-analyzed published data from an independent CyTOF dataset in the context of melanoma immunotherapy (Subrahmanyam et al., 2018): they reported that when they tested frequencies of the specific phenotype identified in the Merkel cell carcinoma trial for a difference in response status in the melanoma immunotherapy dataset, the phenotype was more abundant before treatment in patients who went on to respond to pembrolizumab. In full, it is CD8⁺ effector memory (CD45RA⁻CCR7⁻), CD28⁺, CD127⁻CD25⁻ and PD-1⁺HLA-DR⁺.
The published CyTOF dataset has also been re-analyzed in the Ozette platform: 64 patients, each sampled before treatment, unstimulated and after PMA/ionomycin. Each patient received a single drug, either pembrolizumab (anti-PD-1; 21 responders, 19 non-responders) or ipilimumab (anti-CTLA-4; 10 responders, 14 non-responders), with response defined as progression-free survival of at least 180 days.
Reproducing the published test
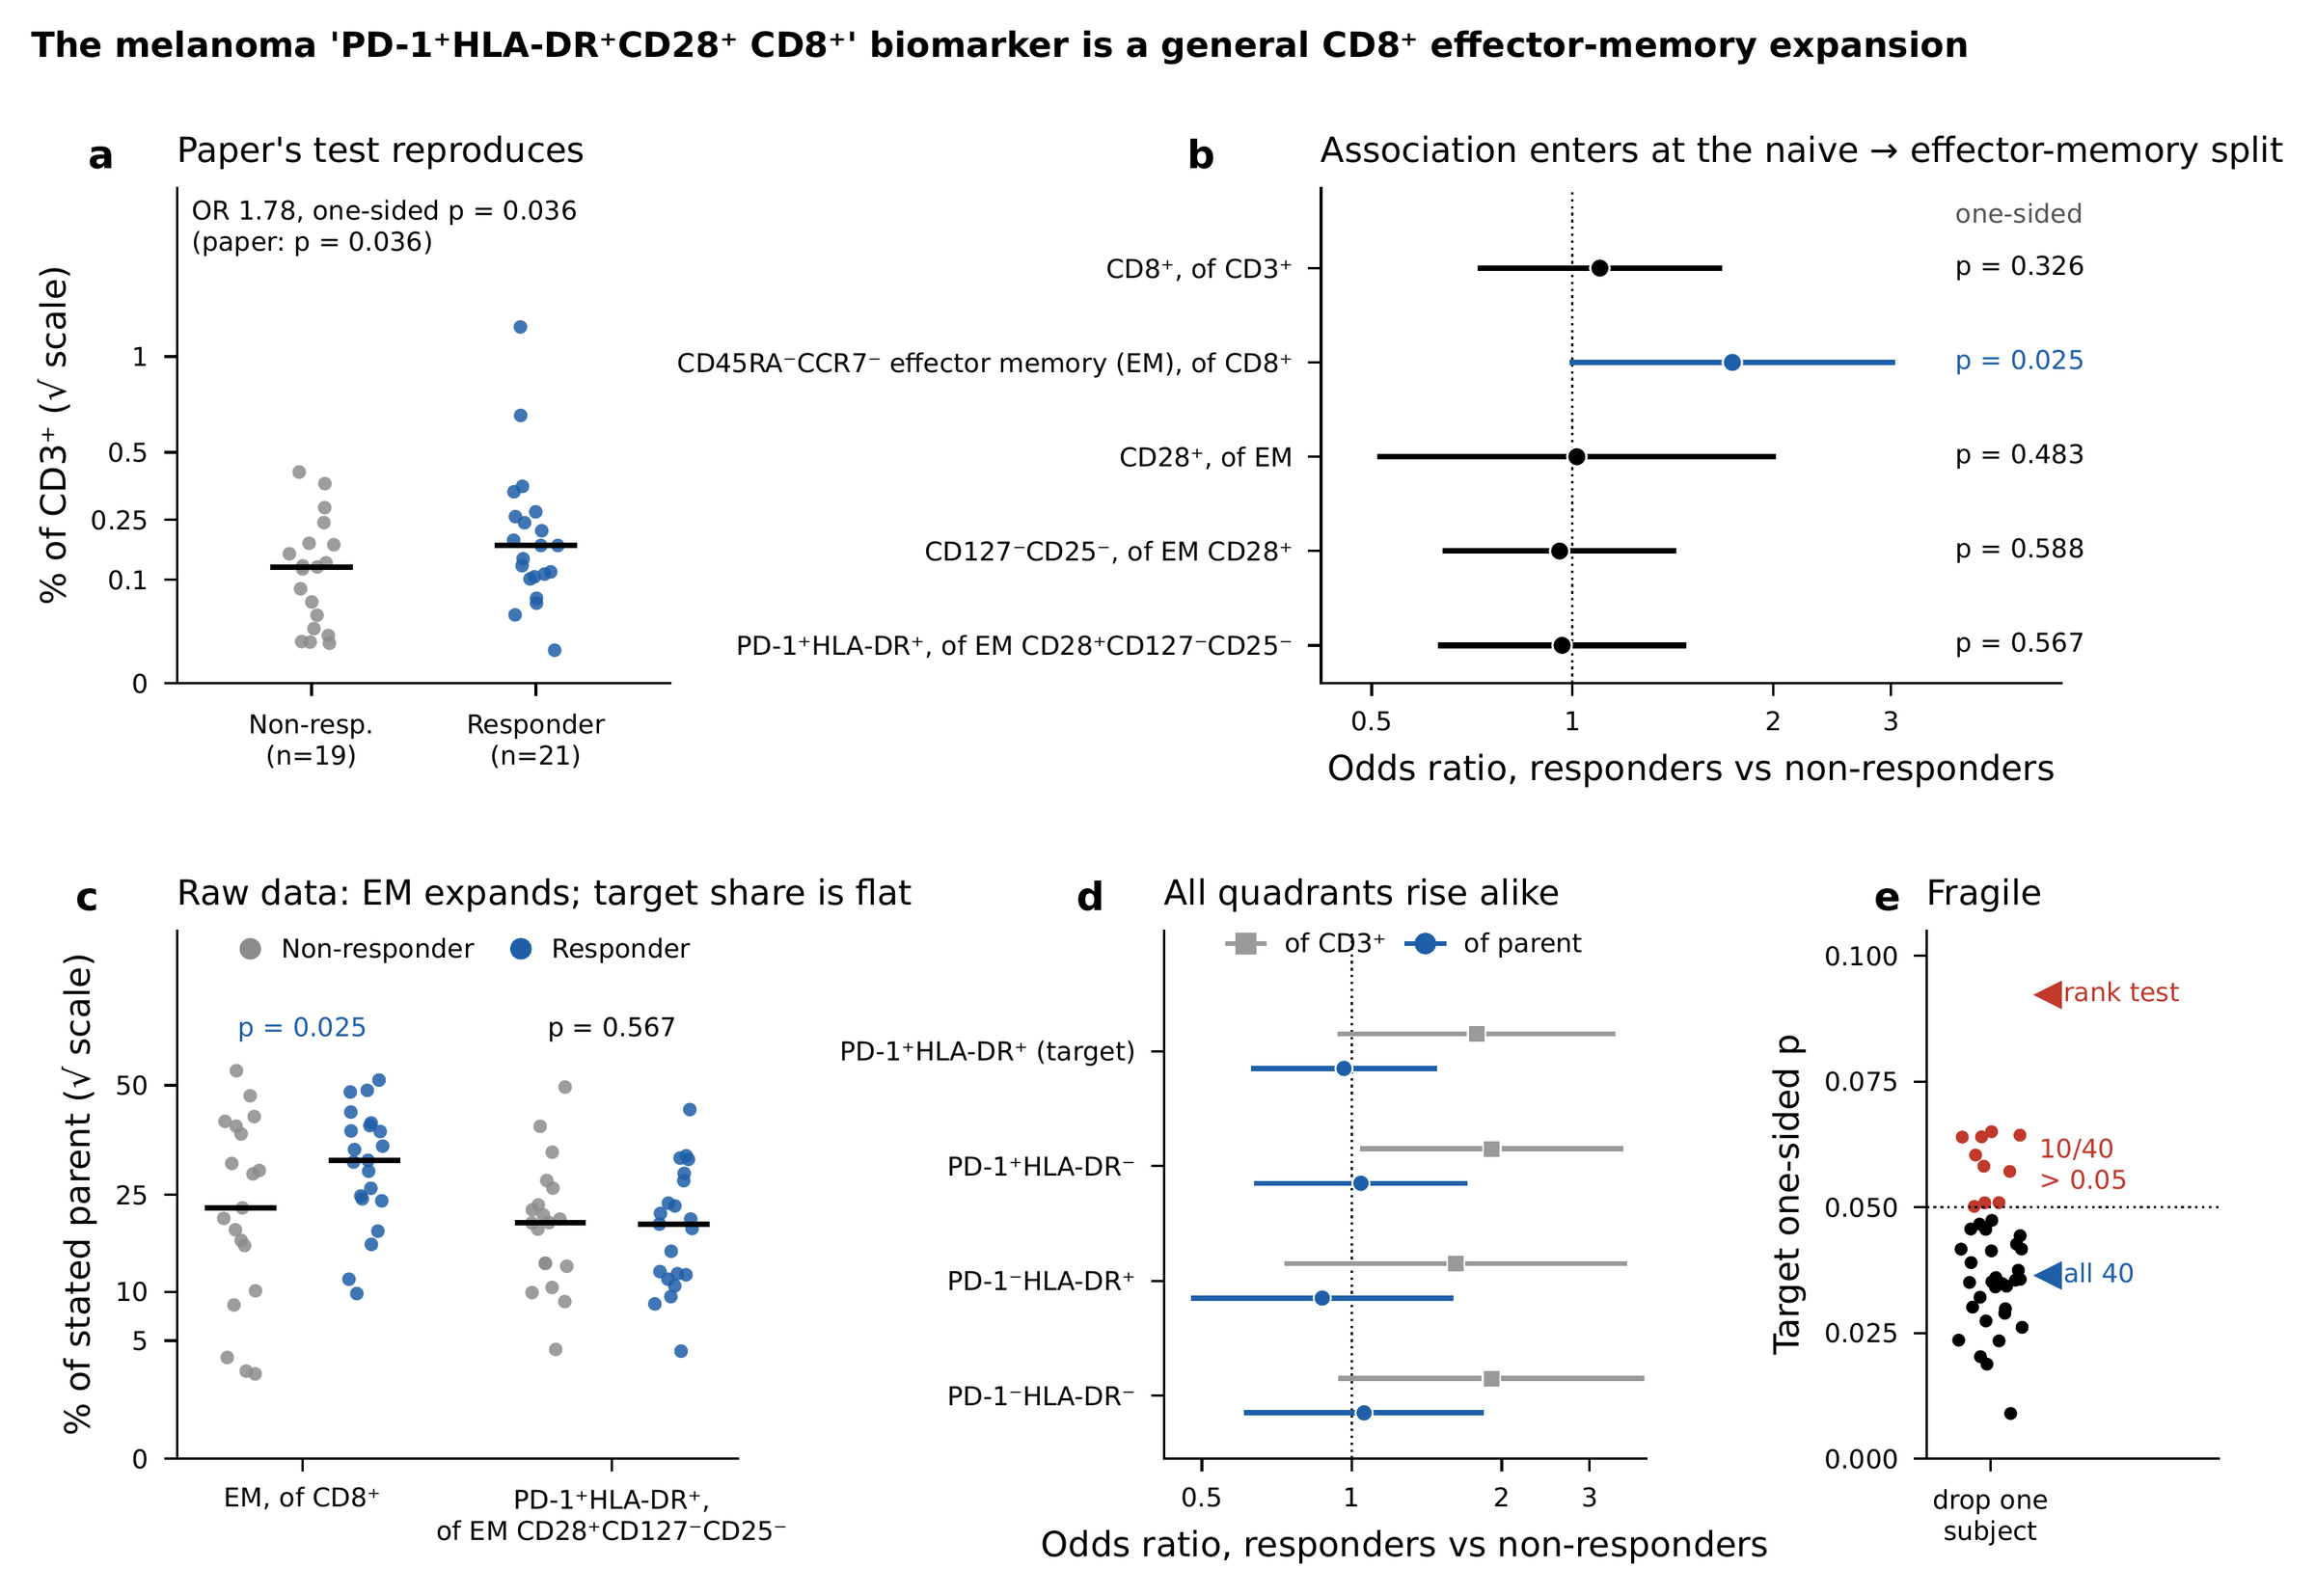
The agent re-ran the paper's test on the 40 unstimulated pembrolizumab samples: a binomial mixed model with the phenotype counted out of CD3⁺ T cells. It gets an odds ratio of 1.78 and a one-sided p-value of 0.036, which is the value the paper reports. Two-sided, p would be 0.073, so the match also implies the paper's test was one-sided.
Taking the phenotype apart
Since the paper reported testing a specific phenotype in the melanoma dataset, it's natural to wonder which of the markers in the phenotype drive the difference in response status. Since the data on Ozette's discovery platform is highly structured, the agent was able to directly look into this question: it took the phenotype apart one gating step at a time, testing each step against the population above it with the same model. The agent found that the association with response to therapy enters at a single step in the melanoma CyTOF dataset: the split of CD8⁺ T cells into effector memory, which is larger in responders (odds ratio 1.74, one-sided p = 0.025). The CD8 compartment as a whole doesn't differ (p = 0.33). Every condition added after the split, CD28⁺, then CD127⁻CD25⁻, then PD-1⁺HLA-DR⁺, has an odds ratio near 1 against the population above it (p = 0.48, 0.59 and 0.57). In other words, responders have more effector-memory cells, but the PD-1⁺HLA-DR⁺ share of its immediate parent is the same in both groups.
If PD-1⁺HLA-DR⁺ cells were the response-specific part of the phenotype in the melanoma CyTOF dataset, they should stand out from similar phenotypes that are either PD-1 negative, HLA-DR negative, or double negative for those markers. They don't. All four PD-1 × HLA-DR quadrants rise to a similar degree as a fraction of CD3⁺ T cells, and none differs as a fraction of its parent under the gating strategy derived by the agent.
The p-value is also driven by a subset of subjects. A rank-based test gives one-sided p = 0.092, and removing any one of 10 of the 40 patients pushes the result above 0.05. Age doesn't explain any of this - the agent checked for an age effect.
In this melanoma dataset, then, the "PD-1⁺HLA-DR⁺CD28⁺" label describes cells that come along with a broader expansion of effector-memory CD8⁺ T cells in responders, rather than a response-specific subset. One question this analysis can't answer: the Merkel cell carcinoma discovery dataset distinguished PD-1 dim from PD-1 bright cells, while the gating in the melanoma CyTOF dataset has a single PD-1 cut-off and so only identifies cells that are either PD-1 positive or PD-1 negative. Therefore one question that is raised from this agentic re-analysis is: do PD-1 bright cells identify response-specific subsets within the CD8 effector memory compartment in the melanoma dataset?
How the agent got there
None of this required a bioinformatician writing custom code for each step. Because every cell in Ozette is annotated, marker by marker, the agent could:
- calibrate every functional marker against the positive control before using it;
- count any marker combination directly, not just the phenotypes in Discovery's summary table (most of the TB subsets that separate the cohorts aren't in it);
- confirm its counts add up: all 2⁷ = 128 signed combinations of the seven TB functional markers reproduce the parent population exactly, in every sample;
- test every marker against acquisition batch;
- take a published phenotype apart, testing each gating step and each neighboring population with the paper's own model.
Corrections to the first post
The first post ran on a development copy of these studies (meaning the data were not processed through our production pipelines; it was an old run), and its marker calls don't pass the calibration check described above: five of the seven functional markers read positive on 71–100% of unstimulated CD8 cells, and the median sample had 20,521 cells called both CD4⁺ and CD8⁺. Three TB findings change as a result:
- The first post highlighted a CD8⁺ population co-expressing CD154, CD107a and multiple cytokines that rose with TB lysate in 33 of 41 subjects. On production data, that phenotype has no cells. The CD8 response to lysate is in IFN-γ⁺ cells, with no cohort difference, and the CD154⁺CD107a⁺ polyfunctional response is a CD4 response, nine times larger in latent infection than in resisters.
- The first post concluded that no robust CD4 single-positive population existed. On production data, 14 of the 42 robust populations are CD4 single-positive.
- The first post's classification ranked two CD8 classes highest, Tc Mixed (1/2) and Tc1. On production data the leading class is Th1, and the type 2 and type 17 classes can't be assessed.
One conclusion holds, on firmer ground: CD154 marks the antigen-specific response, with CD154⁺ CD4 cells rising in 38 of 39 subjects.
In the melanoma case study, the first post described the patients as receiving combination checkpoint blockade and analyzed both treatment arms together. Each patient received a single drug, and the published test belongs to the pembrolizumab arm, where it reproduces at the paper's one-sided p = 0.036, as described above. The UMAP figure in the first post came from the development copy, so treat it as an illustration of the workflow rather than of the biology.
Limitations
Both studies are re-analyses of published cohorts. The TB study has 42 subjects. Its screens are corrected for multiple comparisons within each compartment and antigen, the targeted tests of the paper's four subsets are reported unadjusted, and the polyfunctionality finding is a hypothesis worth testing in independent data. The melanoma comparison has 40 patients and uses the dataset the paper itself relied on, so it reproduces the paper's test rather than validating the biomarker independently.
Final thoughts
Flow cytometry archives hold years of immune data that was analyzed once. With every cell annotated and tied to the study design, an agent can reproduce a published analysis, extend it, and test what a published biomarker actually measures, in a single session rather than a new project. Is the resister response smaller, or just less polyfunctional? Is a biomarker from one trial and one technology a specific subset, or a marker of something broader? With the data in this form, those are some of the questions you can ask. To be clear - you are not limited to reanalysis either. An agent can analyze data de novo with the right context and questions driving its work.
This is available today. If you already work with Ozette, your processed studies are ready to connect to Claude Science, or another MCP-compatible agent your organization uses, through our MCP server. If you don't, we can load and process you historical flow archive onto the Ozette platform. Get in touch at bd@ozette.com, and join us on Thursday, October 15, at 9:00 AM PT for our webinar, Agentic Science Meets Structured Immune Data, where we'll walk through both studies. Register here.
Figures in this post were generated by Claude Science operating over the Ozette MCP server. Statistical values are as computed in-session. References: Lu LL et al. IFN-γ-independent immune markers of Mycobacterium tuberculosis exposure. Nat Med 2019;25:977–987. Subrahmanyam PB et al. Distinct predictive biomarker candidates for response to anti-CTLA-4 and anti-PD-1 immunotherapy in melanoma patients. J Immunother Cancer 2018;6:18. Greene E et al. New interpretable machine-learning method for single-cell data reveals correlates of clinical response to cancer immunotherapy. Patterns 2021;2:100372.
← All posts