Putting Claude Science on top of Ozette: what happens when an AI agent can reason over structured immune data
Update, October 2026: This post is a demonstration of what an AI agent can do when it has annotated, structured immune data to work with. It was run on a development copy of these studies, not on data processed through Ozette's production workflows, so the specific biological findings below should not be taken as results. We've since rerun both studies on production data. See part two for the updated analysis and a list of which findings changed.
We've long argued that getting your flow cytometry data into the Ozette platform is one of the highest-leverage moves a translational immunology program can make. The reason is simple: Ozette turns raw, high-dimensional spectral and conventional flow data into highly annotated, highly structured, context-rich immune data — cell populations resolved by Ozette Discovery, expressed with interpretable marker-by-marker phenotypes, tied to sample metadata, cohorts, treatments, and clinical outcomes. That structure is what breaks down the silos that otherwise trap flow data in one-off analyses and forgotten FlowJo workspaces.
It also happens to be exactly what large language models thrive on. LLMs are strongest when the data they reason over is annotated, self-describing, and connected to context — not a bag of unlabeled numbers. So when Claude Science was announced last month, it looked like the perfect opportunity to test the pairing directly.
We wrote an MCP (Model Context Protocol) server for the Ozette platform and connected it to Claude Science. The agent can now browse workspaces and studies, pull discovery analyses, retrieve Ozette Discovery population phenotypes and per-sample frequencies, join them to sample metadata, and fetch single-cell UMAP embeddings — all through structured tool calls, with no data leaving the governed platform boundary. Then we simply pointed it at real studies and watched what it could do.
Here are a few of the things it found and validated.
Case study 1 — Rediscovering the biology of a TB "resister" cohort
The first study was the Ugandan TB Resister Study: an intracellular cytokine staining (ICS) panel profiling T-cell responses to Mycobacterium tuberculosis antigens across two groups — people who remain immunologically uninfected despite documented, sustained TB exposure ("resisters," RSTR) and latently infected controls (LTBI). The Ozette analysis had resolved the lymphocyte gate into 49 Ozette Discovery populations across 207 samples and five stimulation conditions.
We gave the agent an open-ended prompt: SEB stimulation is a positive control, so look past it — find polyfunctional CD8 or CD4 T-cell populations that increase under antigen stimulation relative to the unstimulated (DMSO) control.
Working entirely from the structured population phenotypes, the agent:
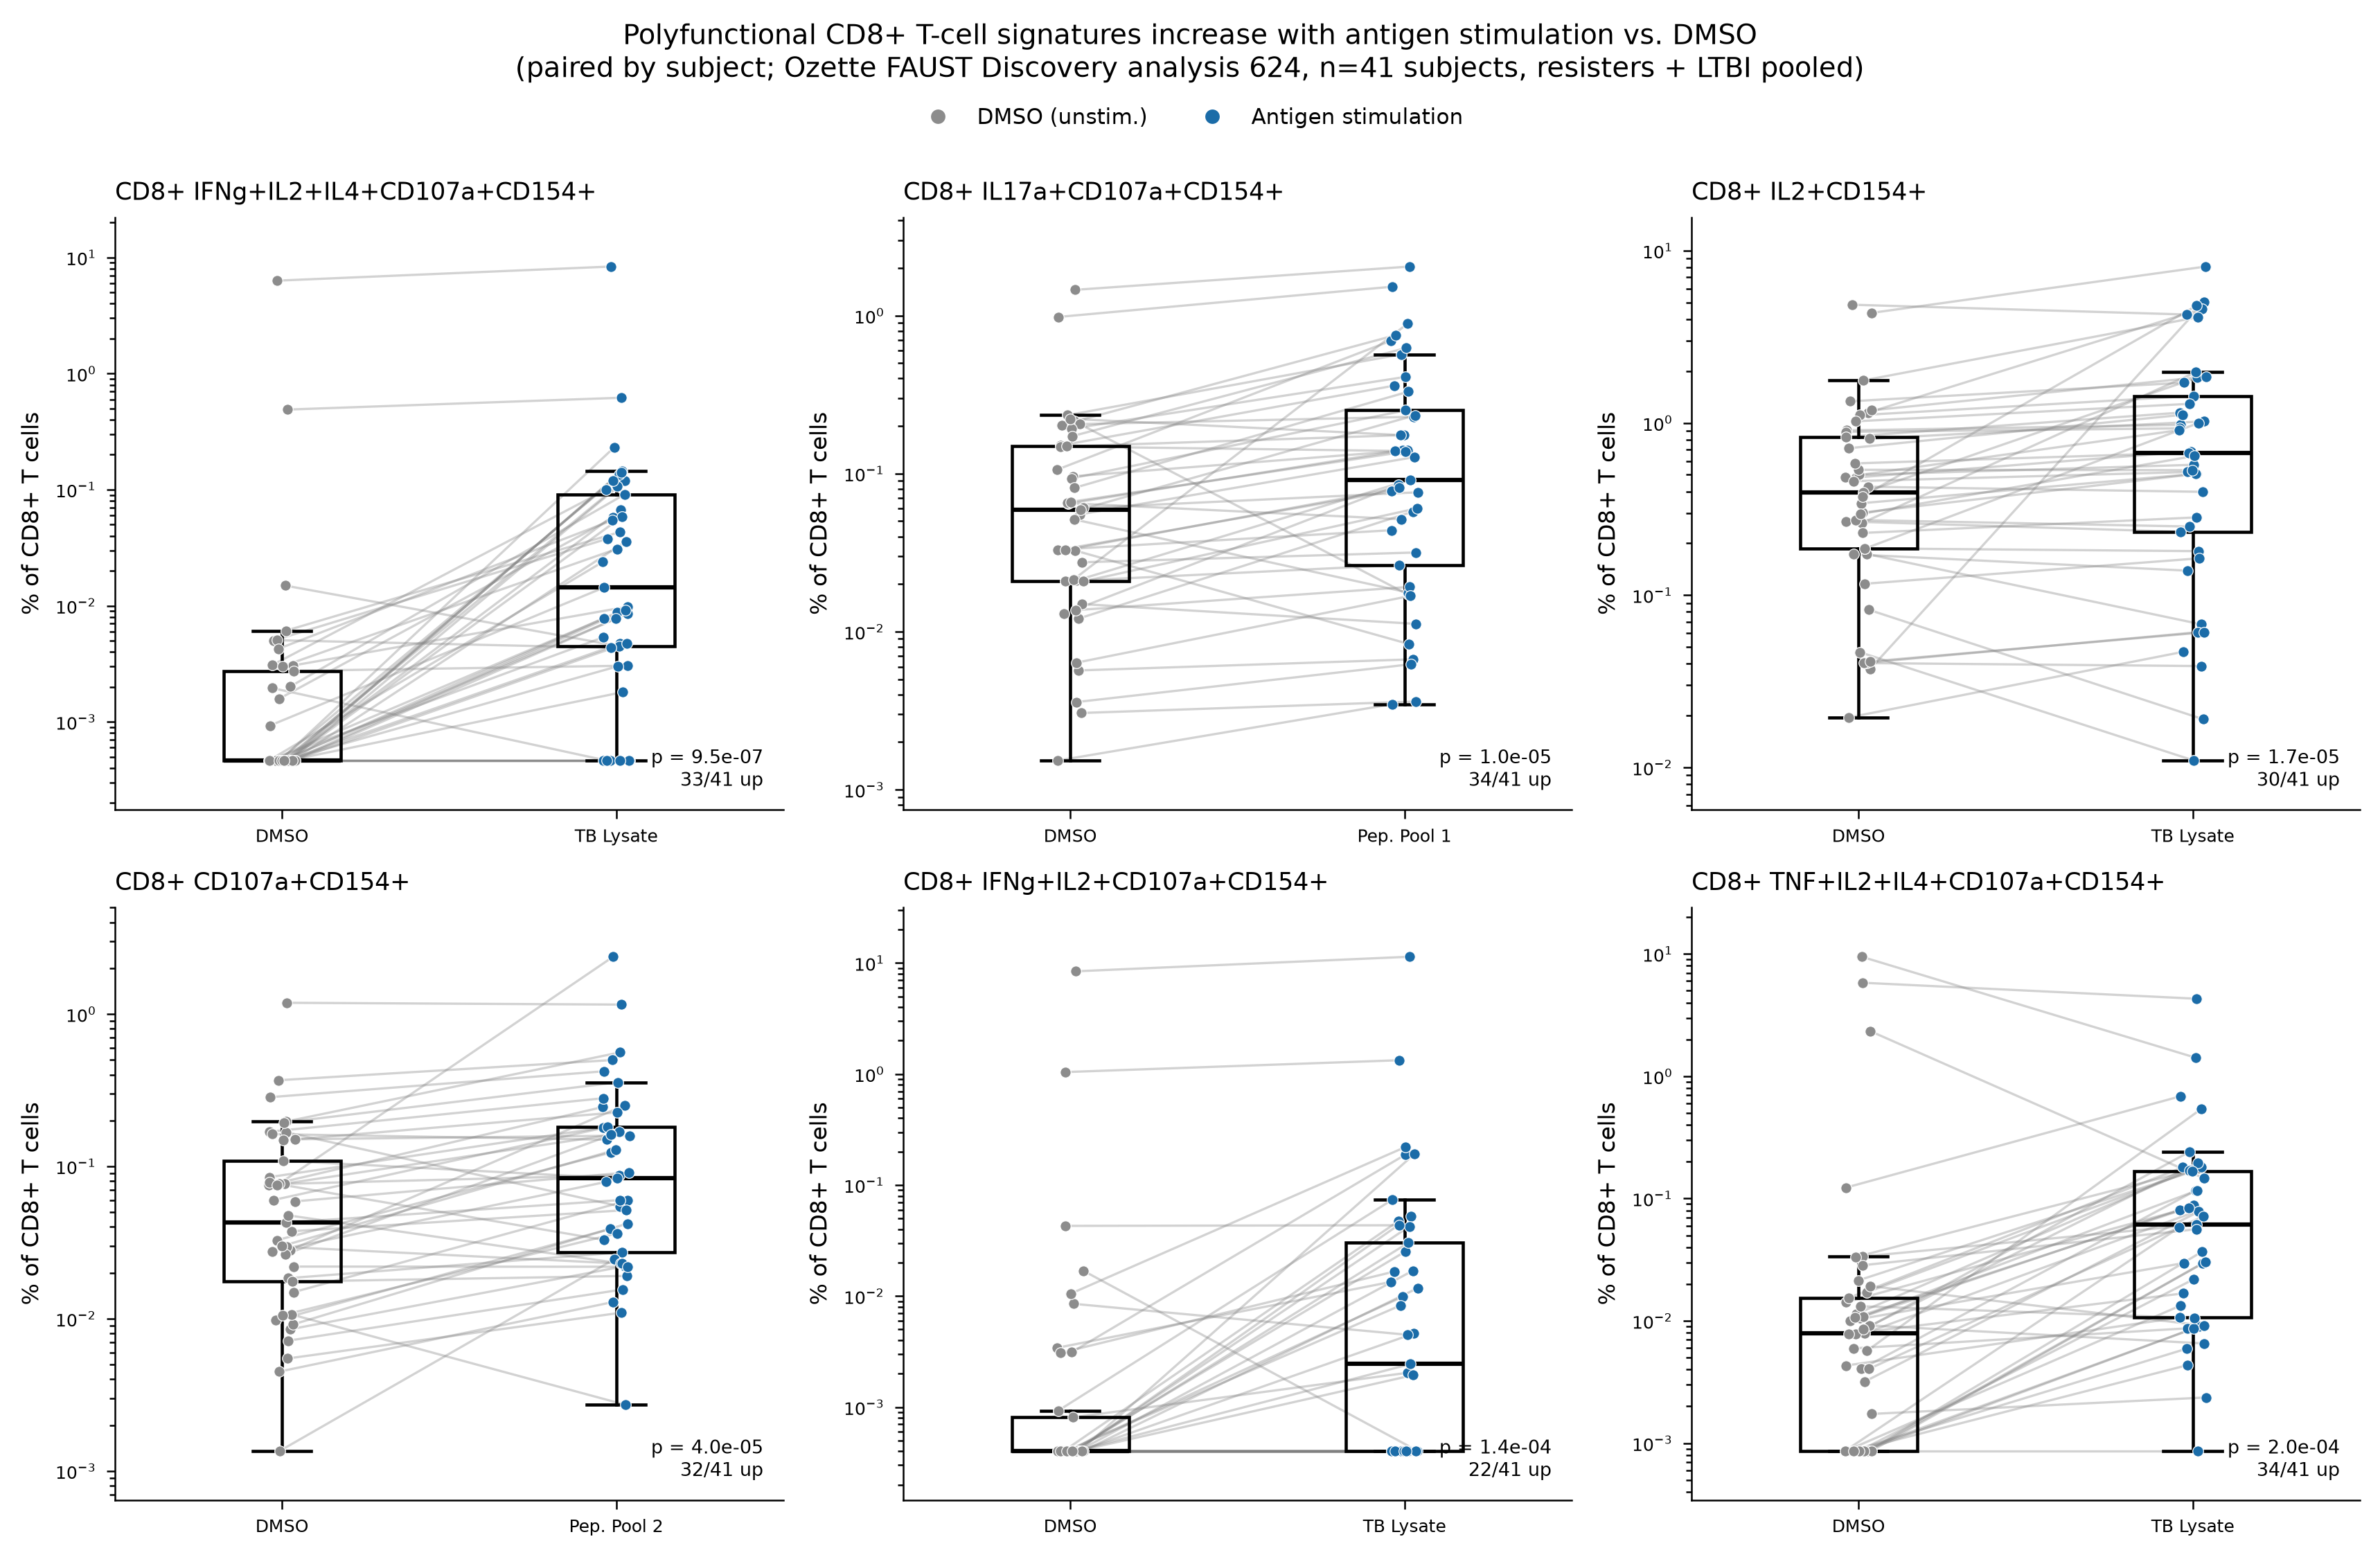
- Identified the polyfunctional CD8 populations (co-expressing two or more functional markers) and ran paired, per-subject statistics comparing each stimulation to DMSO, connecting each subject's paired samples.
- Landed on a highly consistent signal: a CD8+ population co-expressing CD154 (CD40L), CD107a (degranulation), and multiple cytokines rose sharply under TB Lysate stimulation, increasing in 33 of 41 subjects (Wilcoxon p ≈ 8×10⁻⁷).
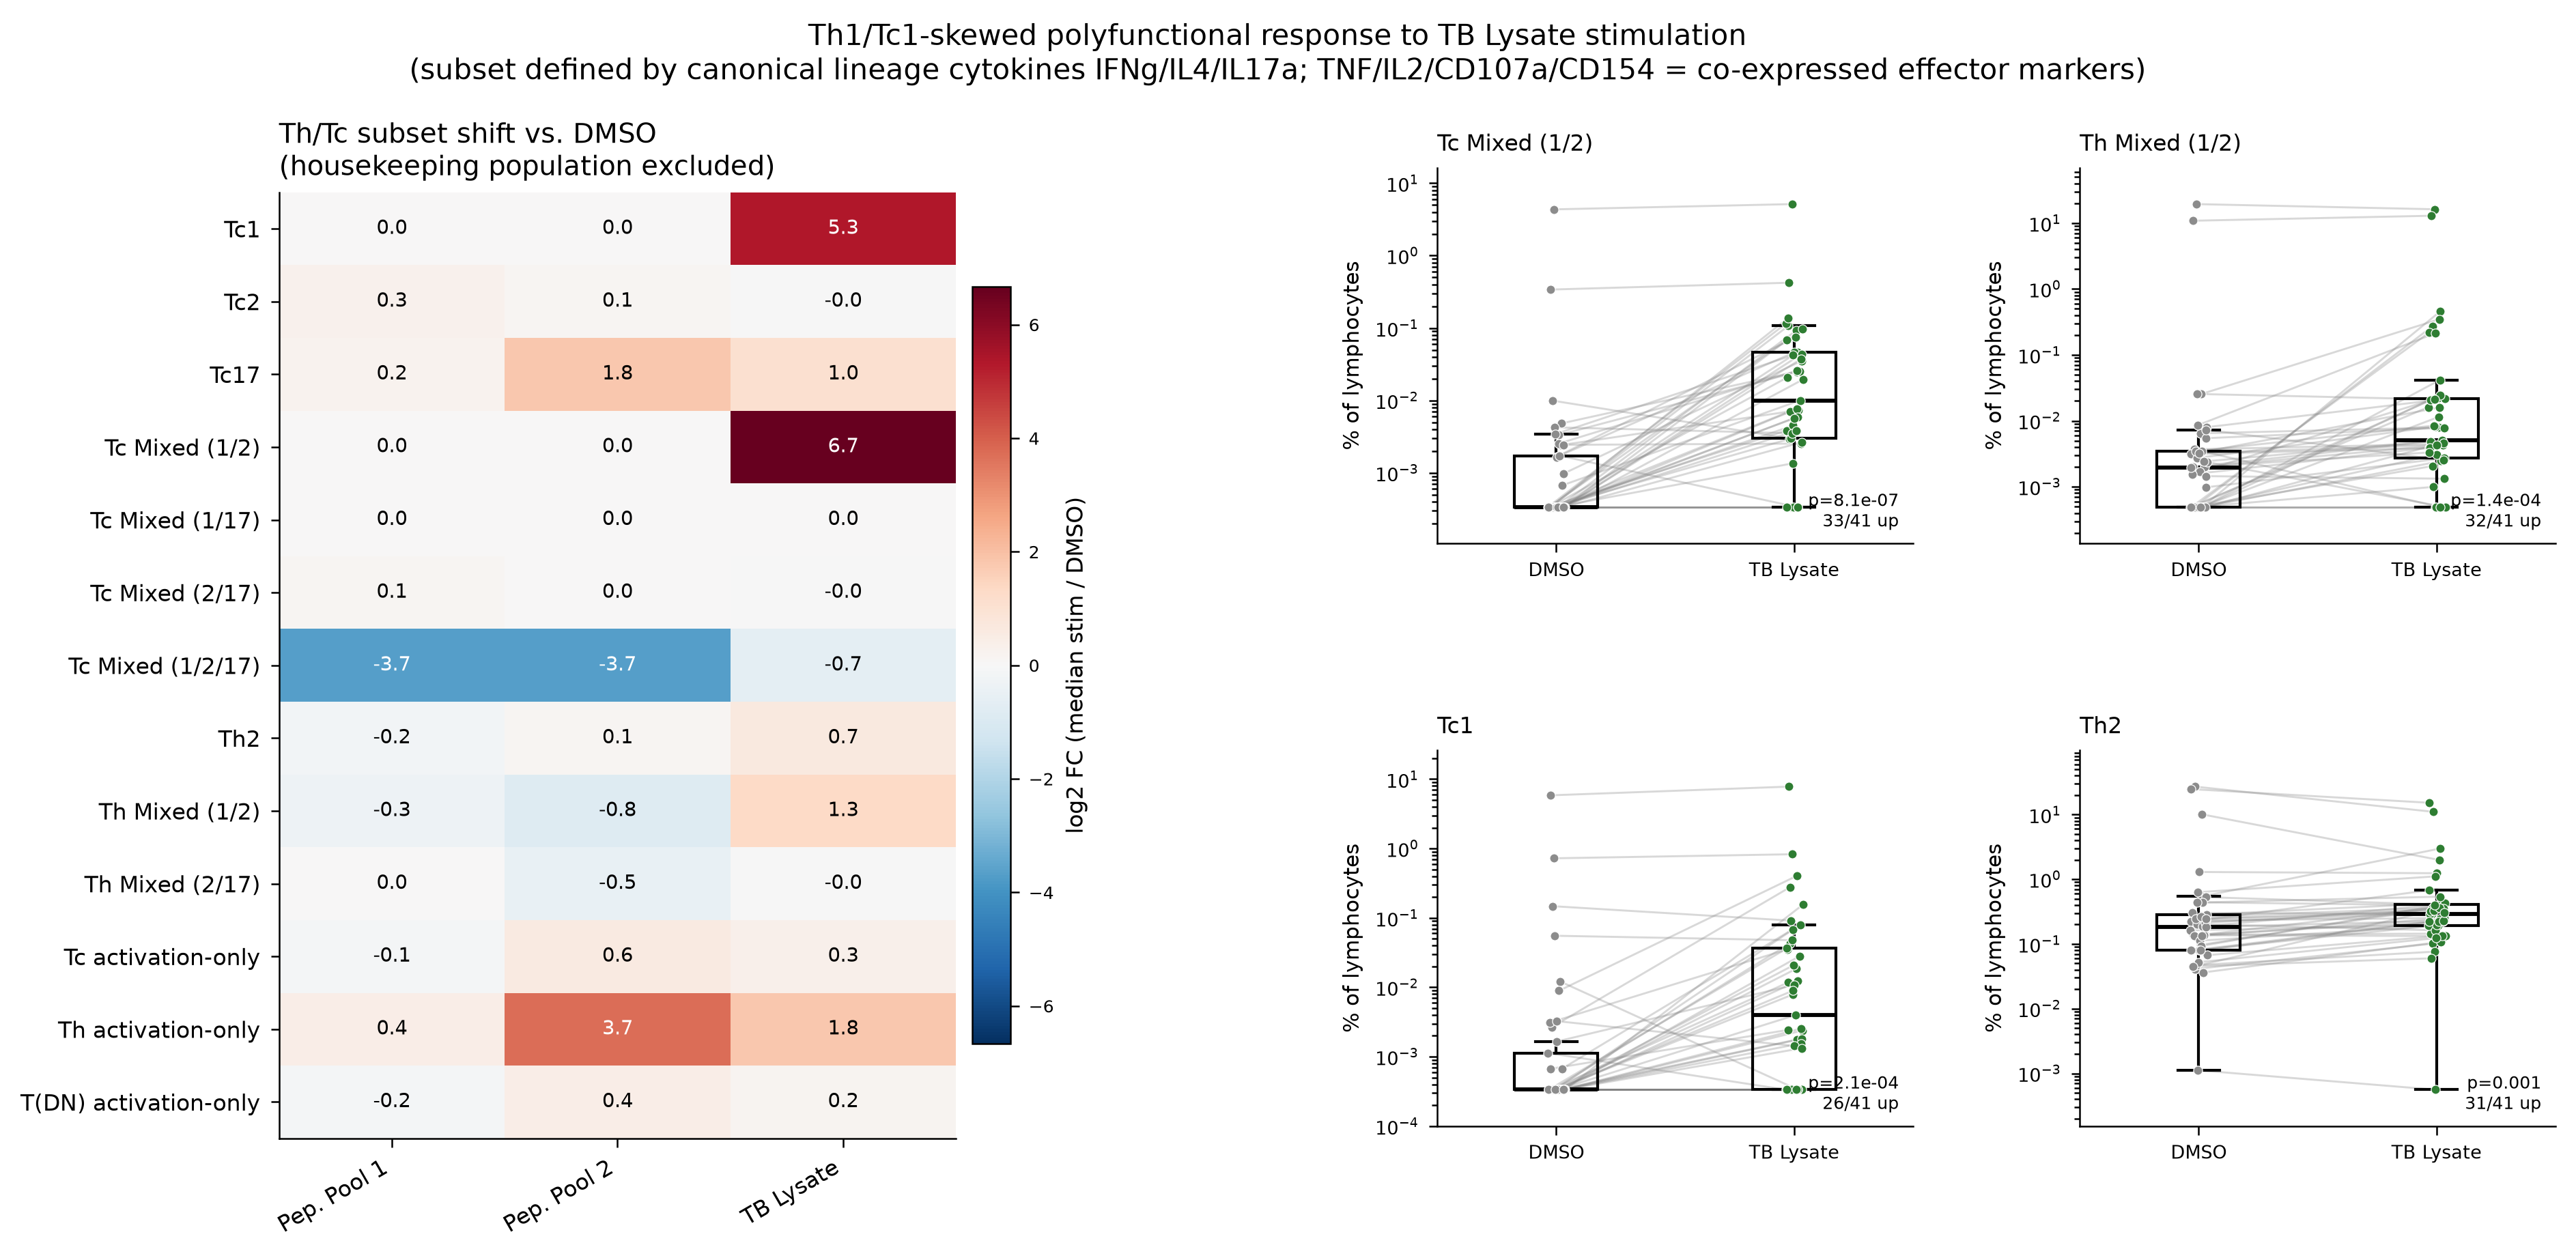
When we asked it to classify the responding populations into helper/cytotoxic subsets (Th1/Th2/Th17, Tc1/Tc2/Tc17), it applied the standard lineage-plus-cytokine logic, caught and corrected an artifact where a dominant baseline population was masking the true antigen-driven signal, and produced a clean subset-level summary.
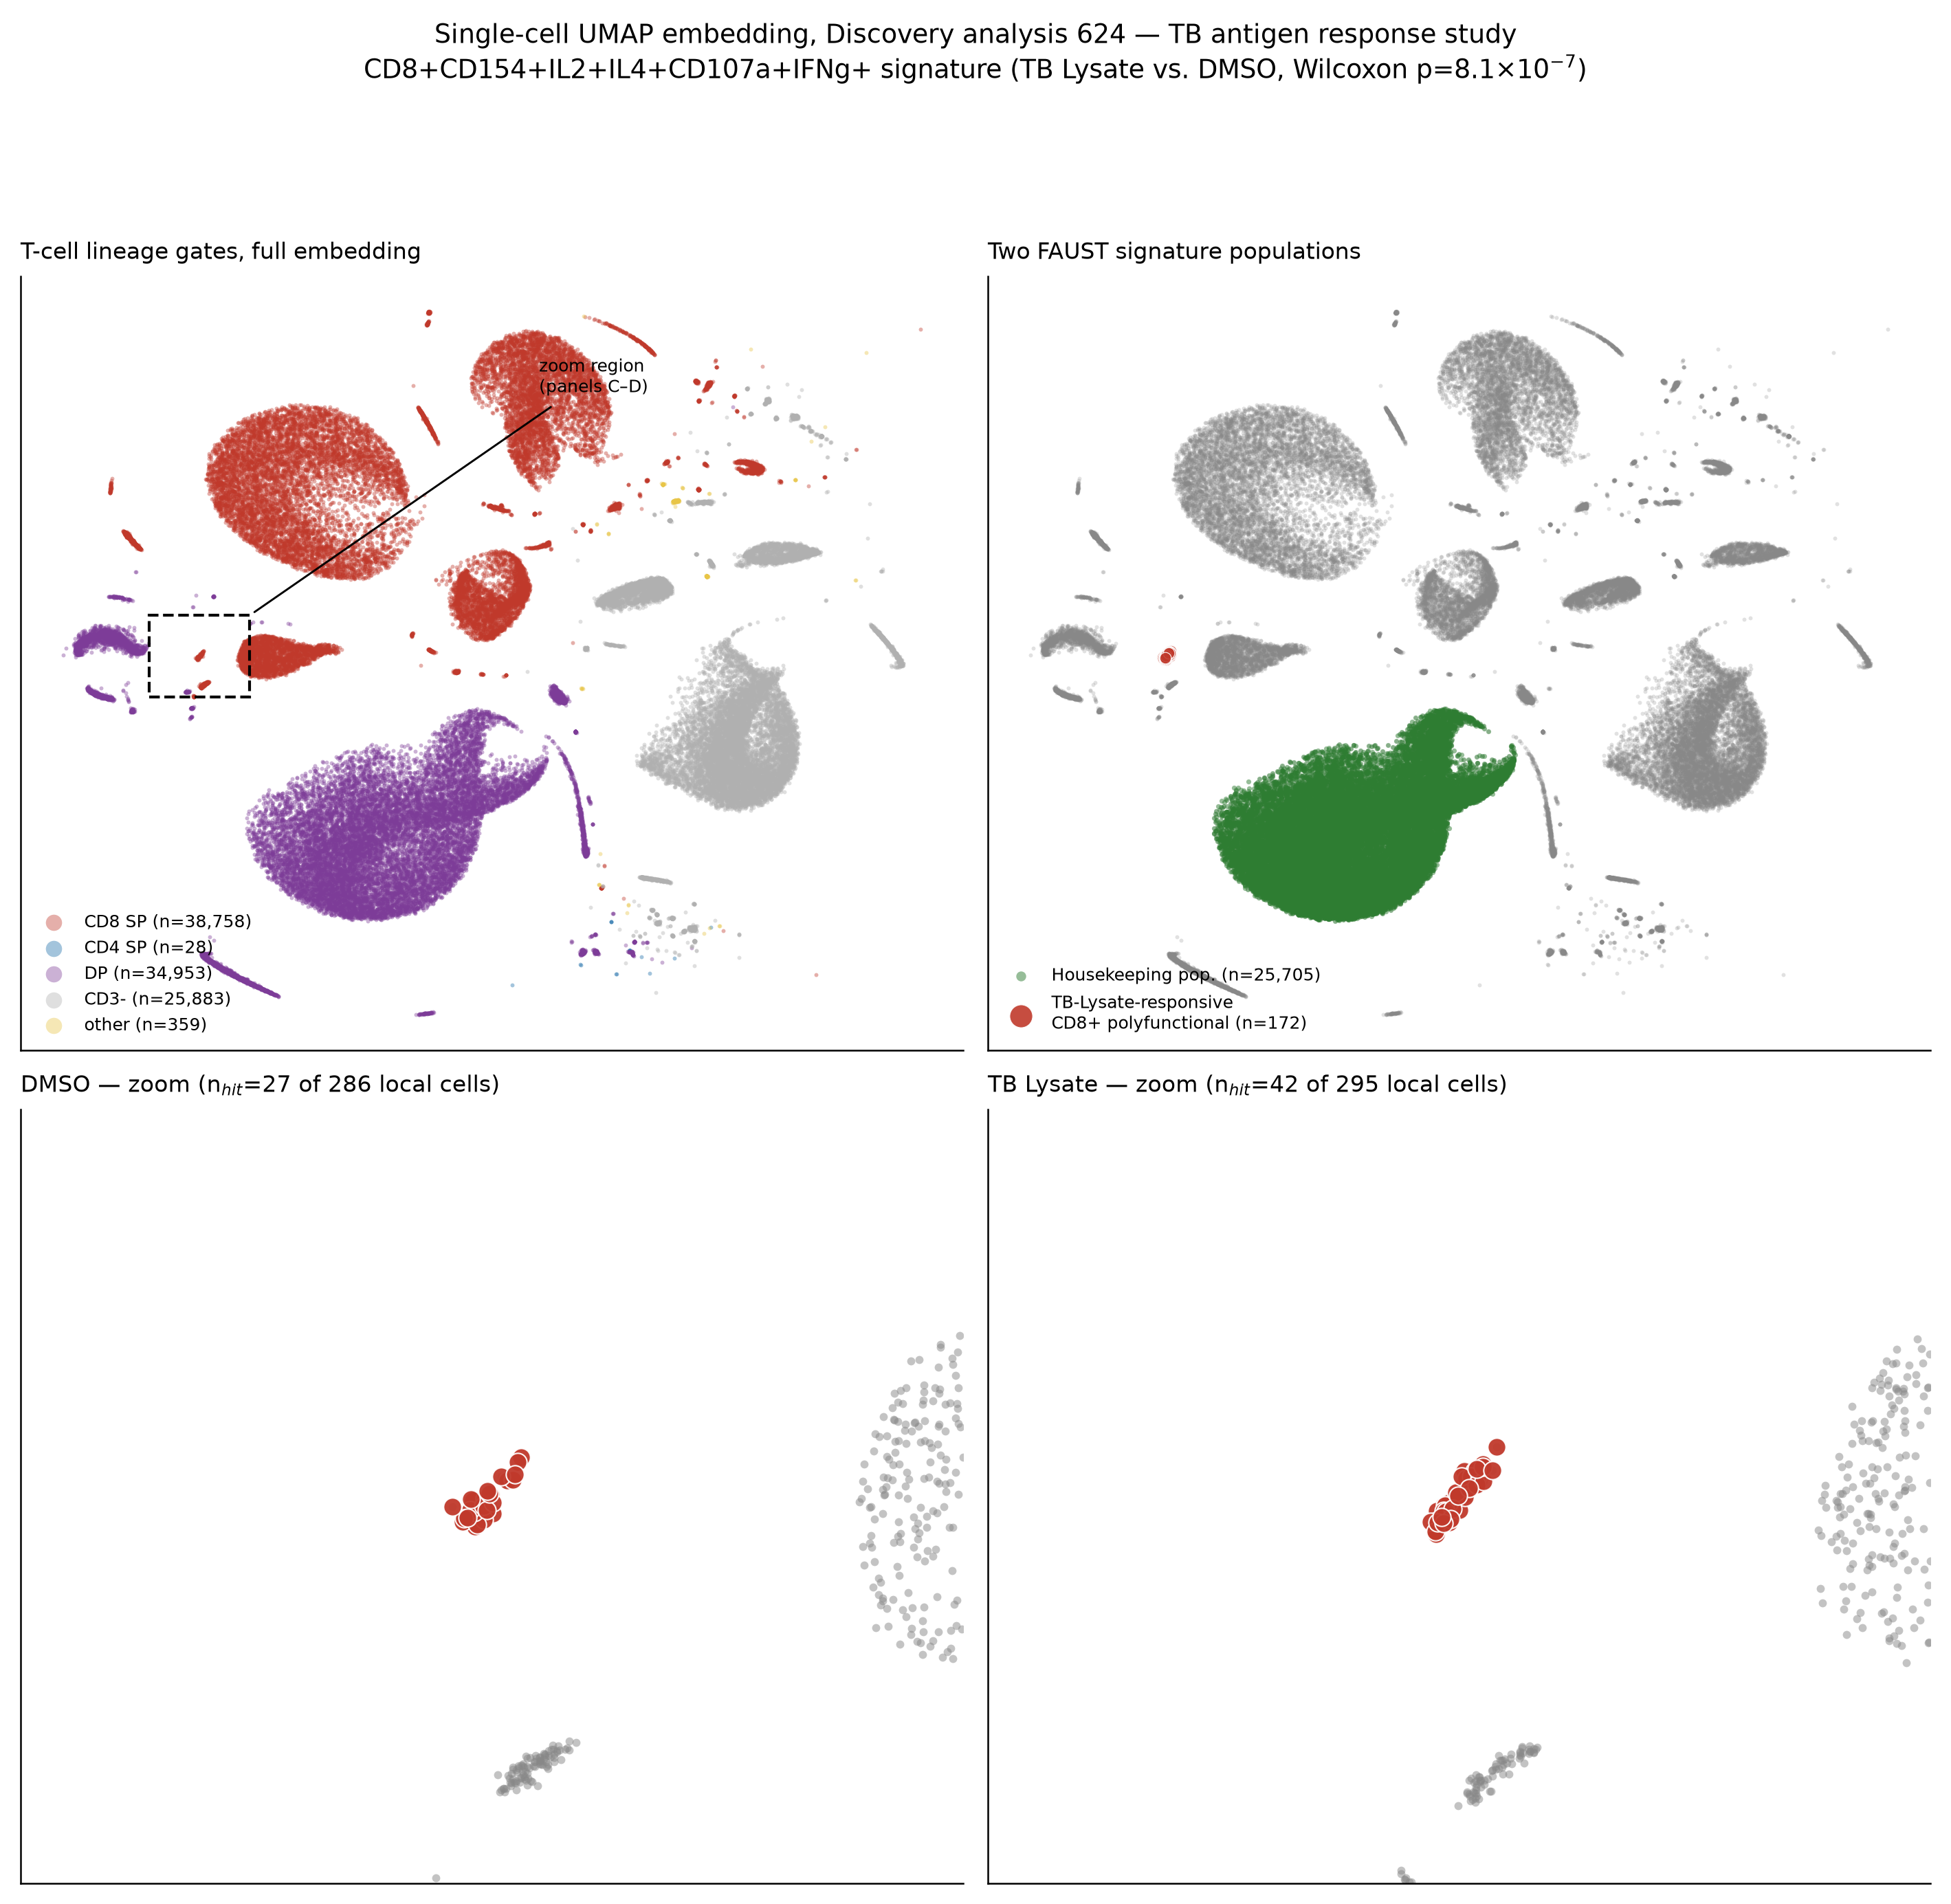
It also worked with the single-cell UMAP embedding to place these populations in the broader immune landscape, and — importantly — reasoned correctly about Ozette Discovery's robustness threshold: when we noted that Ozette Discovery only reports phenotypes that recur across subjects, the agent revised its own interpretation, recognizing that the absence of a conventional single-positive CD4 helper cluster meant no robust one existed, not that the method had failed to resolve it.
The validation. This cohort was the subject of a published Nature Medicine study (Lu et al., 2019), which reported that TB exposure leaves an IFN-γ–independent immunological signature. We handed the agent the paper as a PDF and asked it to compare. It confirmed the same cohort (matching per-condition sample counts), and independently converged on the paper's central themes: IFN-γ–independent antigen responses, with CD154/CD40L as the hallmark marker of antigen-specific reactivity — reached from the structured data alone, without being told what to look for.
Case study 2 — Validating a published immunotherapy biomarker, cell for cell
The second study was a melanoma immunotherapy CyTOF dataset: 128 pre-treatment samples from patients who went on to receive combination checkpoint blockade (anti-PD-1 + anti-CTLA-4), profiled on a 35-marker panel, with each sample labeled Responder or Non-responder. The question was the one every pharma immuno-oncology group cares about: is there a baseline immune signature that predicts who responds?
The agent first ran a broad, unguided screen — thousands of individual Ozette Discovery leaf phenotypes, then a more powered lineage-by-marker aggregation. Nothing survived strict multiple-testing correction. That's the honest and correct answer for a fine-grained, hypothesis-free screen at this sample size, and the agent said so plainly rather than overselling a nominal hit.
Then came the part that shows why structured data plus a reasoning agent is different in kind from a dashboard.
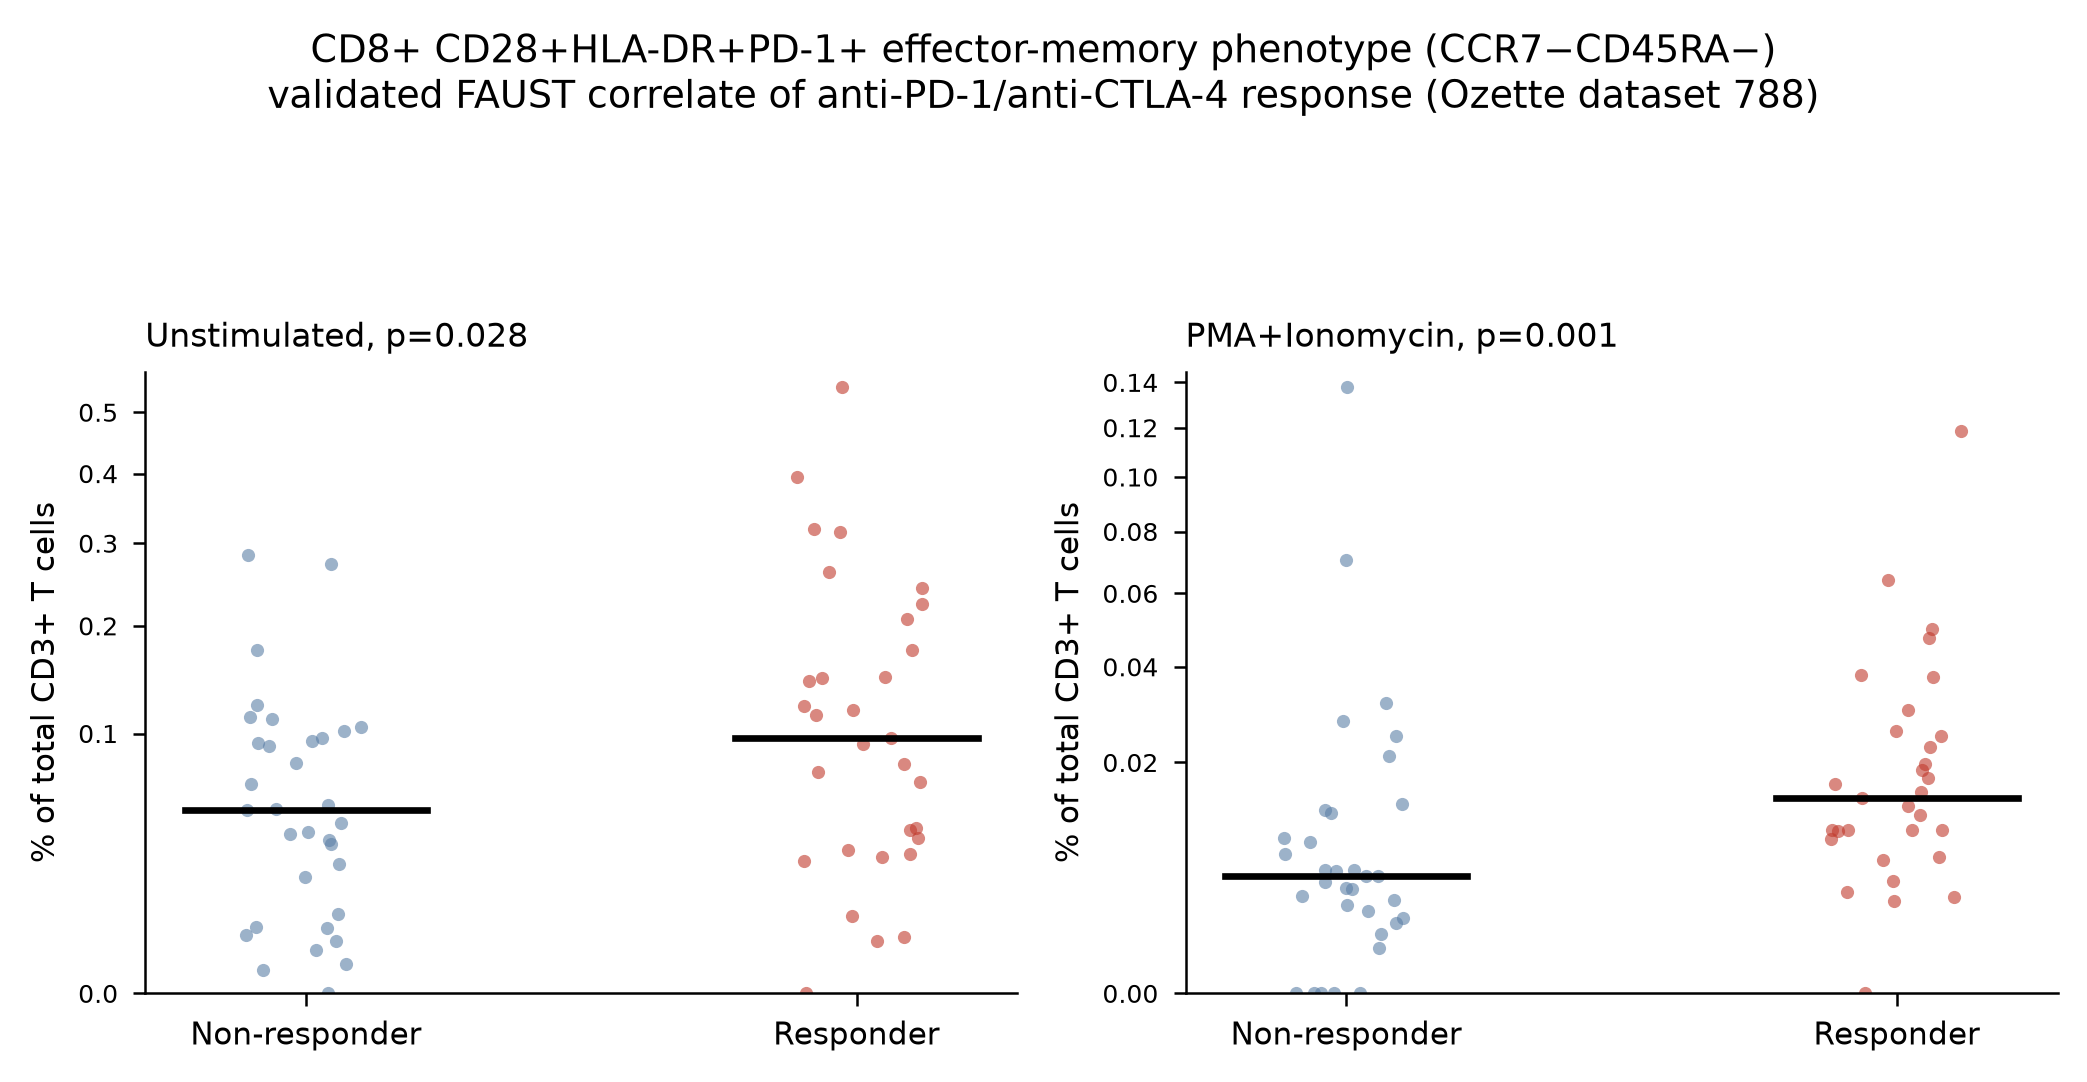
We mentioned that the Ozette Discovery methods paper (Greene et al., Patterns, 2021) had analyzed this very dataset and pulled out a specific population. The agent fetched the paper, located the relevant section, and extracted the exact phenotype the authors had validated: an effector-memory CD8+ T-cell population co-expressing CD28, HLA-DR, and PD-1 (CCR7⁻CD45RA⁻), which the paper first discovered in a Merkel cell carcinoma anti-PD-1 trial and then validated in exactly these unstimulated baseline melanoma samples as being elevated in responders.
It then reconstructed that precise phenotype in the Ozette Discovery population table and re-ran the comparison as a single, pre-specified hypothesis:
| Stimulation condition | Median (Responder) | Median (Non-responder) | Mann-Whitney p |
|---|---|---|---|
| Unstimulated (matches paper design) | 0.097% of CD3+ | 0.050% of CD3+ | 0.028 |
| PMA + Ionomycin | 0.014% of CD3+ | 0.005% of CD3+ | 0.001 |
The result reproduced the published finding — same direction, significant in both stimulation arms — and did so as a targeted test with far more statistical power than the blind screen.
An agent moved from a public paper's methods section to a cell-population definition to a reproduced, quantified biomarker association in the platform's own data — in a single session, without a bioinformatician writing custom code for each step.
Why this matters at scale — mining and integrating historical flow data
Both case studies used data that was already in Ozette. That's the point. The moment flow data is processed through Ozette's pipeline, it stops being an inert file and becomes a queryable, annotated, context-rich object — and that is what makes it tractable for an AI agent to reason over.
Now imagine this at the scale of a pharma organization sitting on years of historical flow cytometry from dozens of trials:
- Silos dissolve. Data from different trials, panels, instruments, and eras becomes uniformly annotated and comparable. Ozette Discovery's standardized phenotypes are what let the melanoma finding above be validated across studies and technologies in the first place — the same mechanism lets an agent ask one question across an entire archive.
- Cross-study hypothesis testing becomes routine. A phenotype implicated in one indication can be targeted immediately in every other dataset that has the relevant markers — no re-gating, no bespoke pipeline per study.
- Literature is a live input, not a footnote. As shown, the agent can pull a published biomarker and test it against internal data on the spot, turning the external literature into an executable hypothesis generator against your own archive.
- The tedious work compresses. Population comparisons, paired statistics, multiple-testing correction, publication-quality figures, and honest caveats — the agent produces these in minutes, with the analyst supervising the science rather than writing the plumbing.
- Rigor is preserved. In these sessions the agent flagged underpowered comparisons, corrected its own misinterpretations when given domain guidance, and refused to oversell nominal hits. Structured data with real context is what makes that discipline possible — the model reasons over the actual phenotypes, cohorts, and outcomes, not a vibe.
A note on security and access
A natural question for any regulated data environment: what can the agent actually see? The answer is: exactly what the connected account can see, and nothing more. The MCP connector enforces Ozette's existing workspace- and study-level permissions — the agent cannot discover or query data outside the scope granted to the user or service account driving it. In this session, for example, different workspaces surfaced different sets of studies, exactly as they would for a human analyst logged into this same account. Every call the agent makes — listing workspaces, pulling a discovery analysis, fetching a population count matrix — is a discrete, logged request, the same audit trail a human analyst would leave clicking through the platform directly. Connecting an AI agent to your data does not mean widening who or what can see it.
Final thoughts
The richness of data processed through Ozette's immune platform — combined with its high data quality and robustness — is unmatched for exploring the immune system. Connect that to a reasoning agent like Claude Science, and a decade of historical flow data stops being a storage cost and starts being a discovery engine.
And this is available today. Whether you're already working with Ozette or not, we can help you build a structured, annotated corpus of immune data from your retrospective and prospective studies — then you can connect it to Claude Science - or whatever Agentic reasoning engine your organization is running — through our MCP server, and put these capabilities to work across your discovery and development programs.
figures in this post were generated by Claude Science operating over the Ozette MCP server, from the studies described. Statistical values are as computed in-session.
← All posts