Headed to AACR? Schedule time to connect with us at bd@ozette.com
Evan Greene, Chief Officer Applied Sciences
Are you regularly generating spectral cytometry data? If so, do you:
If you answered “yes” to any of the above, chances are you’ve had conversations with your colleagues that are similar to conversations we’ve had inside Ozette. In fact, these are the kinds of conversations that led us to build Ozette Resolve Spectral Unmixing, our instrument-agnostic solution for evaluating unmixing controls and performing adaptive unmixing of spectral cytometry datasets.
Time and again we found that errors introduced in the unmixing process were the root cause of complex issues we observed in downstream data analysis. The nature of the errors varied. Sometimes, a stain wasn’t behaving as expected. At other times, undetected cross-contamination of single-color controls compromised the estimated spectral signatures. In still other cases, fluors with highly similar spectra interacted with the specific mathematical unmixing model to produce strange artifacts.
Whatever the error, as an organization we decided that we needed a system to surface and correct these kinds of issues in data we analyzed. Our solution is called Ozette Resolve. We use it to reliably deliver high-quality unmixed outputs for all spectral datasets that we generate or analyze. Our customers also use the system to unmix their own data to achieve similarly high-quality outputs.
We’ve realized there is significant value in using Ozette Resolve to monitor the quality of unmixing controls over time: changes in experimental factors like disease states, reagents, buffering systems, stimulation conditions, and biological matrices can all affect unmixing outputs by altering the spectral signatures and autofluorescence of the samples. By monitoring the performance of controls through the Resolve workflow, we are able to identify issues in control files that would produce unmixing errors. And by remediating these issues before unmixing the raw data, we prevent errors that would confound downstream analysis from appearing in our unmixing outputs. This saves us substantial time and effort up front. We think your team can achieve similar efficiency savings and superior outputs by updating your workflows with Ozette Resolve.
To help you reach this goal, we’ll discuss our own set of best-practices for optimizing unmixing outputs through Ozette Resolve. Even if you’re not using Ozette Resolve today, you may still find it worth your while to read these discussions since many of these suggestions apply to cytometry in general. Our first topic is a critical, but often overlooked, component of any experiment: unstained controls.
Unstained controls are used to estimate the autofluorescent properties of materials measured on a cytometer. These controls are particularly valuable in Ozette Resolve, since it calculates event-specific autofluorescence estimates from these controls.
Many conventional approaches aim to account for autofluorescence by using an unstained control to estimate one or several autofluorescent profiles, either on the bulk cell population measured in a sample, or subdivided into different gated populations based on light scatter profiles (e.g. Lymphocytes, Monocytes, Granulocytes). These autofluorescent profiles are then often adjoined to a fixed unmixing matrix.
In Ozette Resolve, unstained controls are instead used to estimate event-specific autofluorescence contributions. The system therefore benefits when you use paired unstained controls for each sample you unmix, since generating paired controls provides the system with the best possible data to estimate autofluorescence contributions for the types of events actually measured in a given sample.
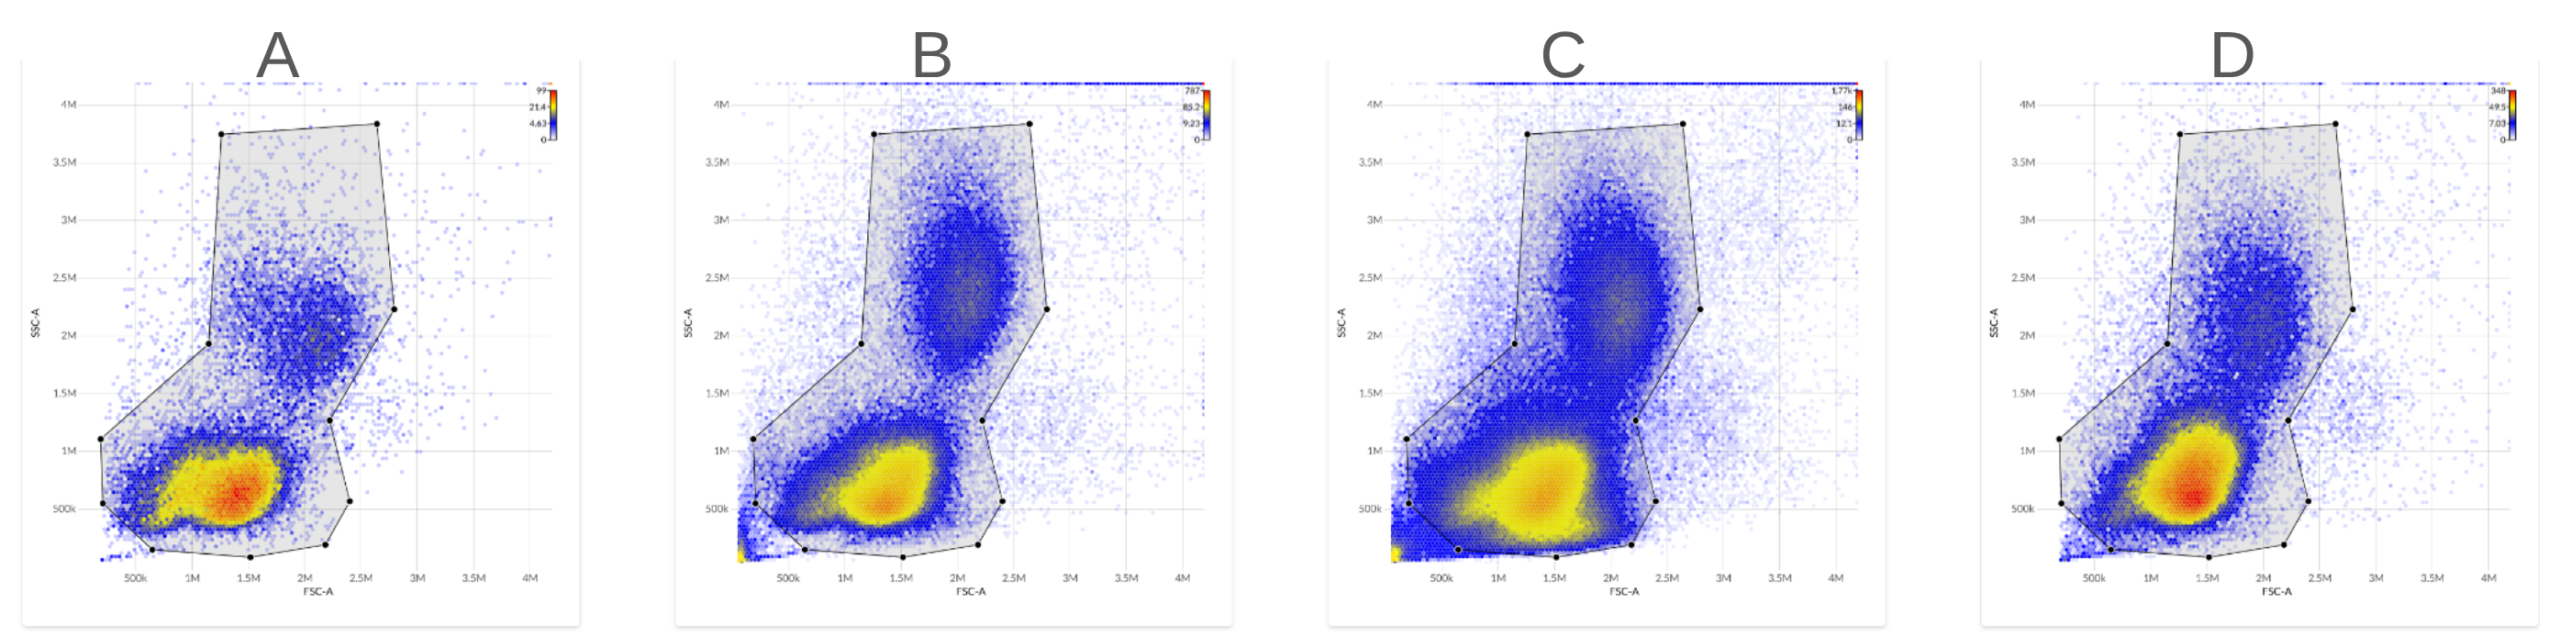
To see this, consider four unstained PBMC samples from four different subjects. We can immediately see differences in the scatter properties of the four assayed samples.
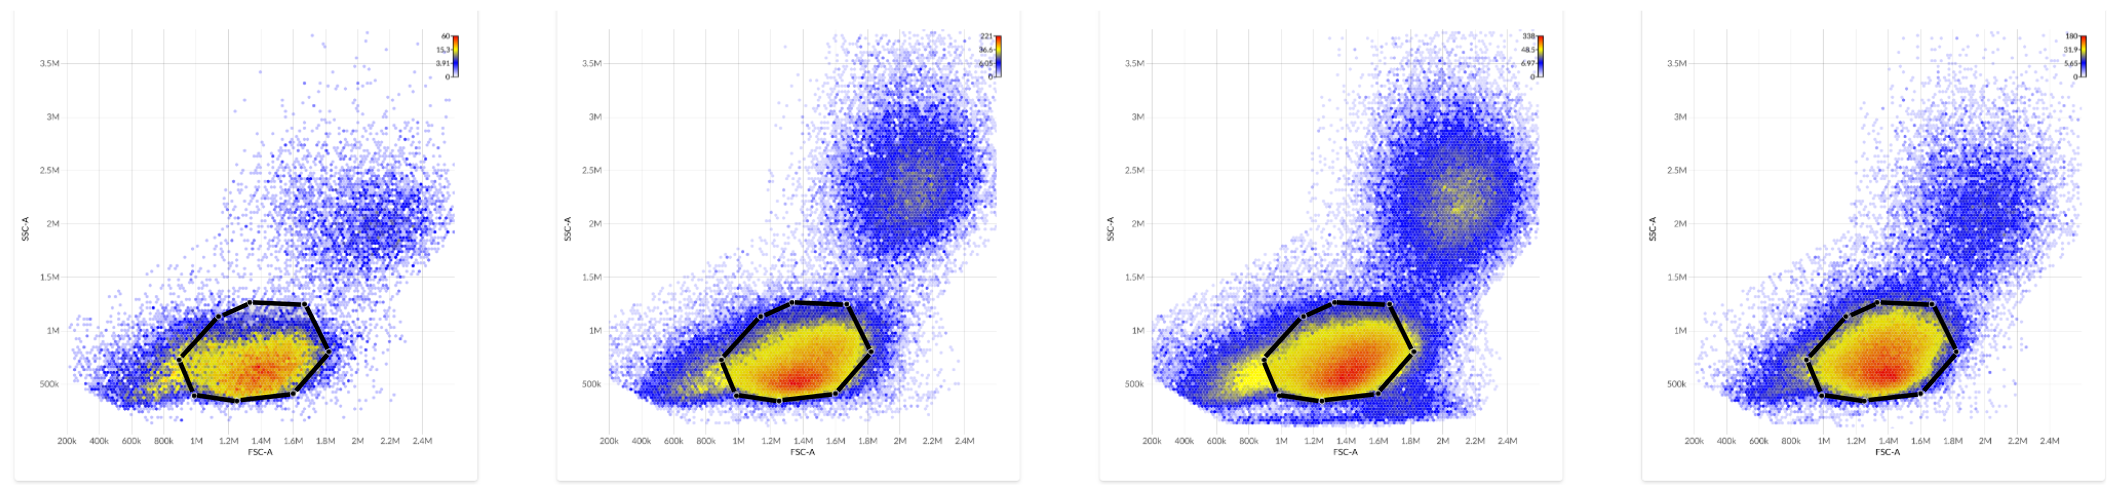
we can compare the median measured autofluorescence intensity within lymphocytes across the four subjects.
On the one hand, this overlap implies that many events can have their autofluorescence properties reasonably well-approximated by either sample, since both files contain events with similar autofluorescence signatures. On the other hand, despite this overlap, we can see that the dimmest events in the dimmest sample would be not be well-approximated using the brightest sample, and conversely the brightest events in the brightest sample would not be well-approximated by using the dimmest sample, since each sample lacks example events with those empirical autofluorescence characteristics.
While PBMCs stained to measure lymphocytes represent a somewhat simple use case, observing variable autofluorescence profiles between subjects and experimental runs have led us to develop the following recommendations for using unstained controls in Resolve:
To be clear, we have achieved high-quality unmixing through Resolve under all three recommended scenarios. However, we have found it helpful to recommend this hierarchy of prioritization, as paired unstained controls are particularly valuable for calculating the recently developed positivity scores included in Resolve unmixing outputs. Positivity scores are a novel metric generated as supplementary parameters through Resolve. This metric can be used to inform objective gating and will be discussed in detail in a future post.
In our next article, we will discuss how to use Ozette Resolve to detect and remediate cross-contamination between single stain controls. In the meantime, if you’d like to try these recommendations with Resolve today, try our 30-day free demo at https://ozette.com/biological-insights/.