
Control Sets are curated collections of control files used to unmix multicolor data. Resolve allows you to create multiple control sets from a collection of control files because you may not immediately know which controls you want to use for the final unmixing. For example, you may have controls generated on multiple material types for each fluor (e.g. both beads and cells) and want to determine which will provide the best unmixing.
When you initially create a control set in Resolve, you may include controls of different material types for each fluor (e.g. both beads and cells) to bring into the gating experience. Thus, you can simply examine your controls rather than guessing which will work best before you see the data. You can then choose the most appropriate control material for each fluorophore to carry forward into the final unmixing.
Your finalized control set will therefore include:
- One unstained control per material type
- One single stain control per fluorophore
- Gating information to guide the unmixing algorithm
Creating Control Sets
- Add new control set
- Go to “Manage Control Sets”
- Click “Create Your First Control Set”
- Provide unique name (example: 15c immunophenotyping control set – cells only)
- Select control files
- Choose appropriate controls from your uploaded files
- Note that you can sort and filter the listed files based on File Name, Control Type, Protein, Fluor, Material Name, Run Date, and Source Panel in order to identify the relevant files for your current control set
- Click “Create”
- Verify that correct files have been included, and then click “Proceed to Gating”.
- Choose appropriate controls from your uploaded files
- Inheriting from a previous control set
- For your first control set for a given panel, you will need to execute all gating
- However, should you want to iterate on your gating or if you run new controls and need to create a new control set, we have a feature that allows you to inherit the gating and spectral filtering from a previous control set. This optimizes for consistency and efficiency across analyses.
- Once you have selected the control files and clicked to “Proceed to Gating” you will see an option to inherit the gating and spectral filtering from a previous control set, or create a new gating tree.

- Once you have selected the control files and clicked to “Proceed to Gating” you will see an option to inherit the gating and spectral filtering from a previous control set, or create a new gating tree.
- Optional: Delete/archive control set
- You can delete a control set so long as it has not been used to unmix multicolor files in a Resolve Run. Please note, delete is permanent.
- If the control set has been used to unmix multicolor files but you no longer want it visible in the panel, a control set can be archived. To un-archive a control set please contact support@ozette.com
The Gating Process
Correct gating is crucial for algorithm performance for any unmixing protocol. To assist with this task, Resolve provides two gating experiences: templated and manual. This document describes the templated experience. For questions about the manual experience please contact support@ozette.com.
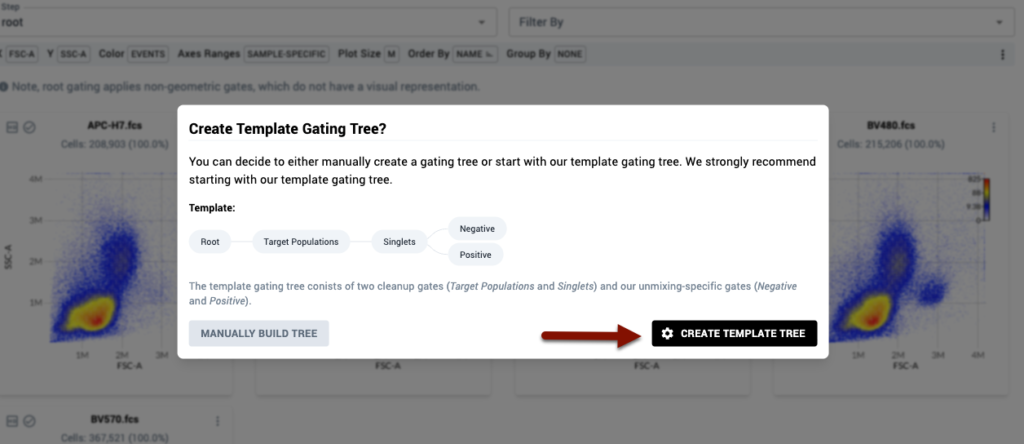
To initiate the templated gating experience, click the “Create Template Tree” button when prompted when you first enter the gating page.
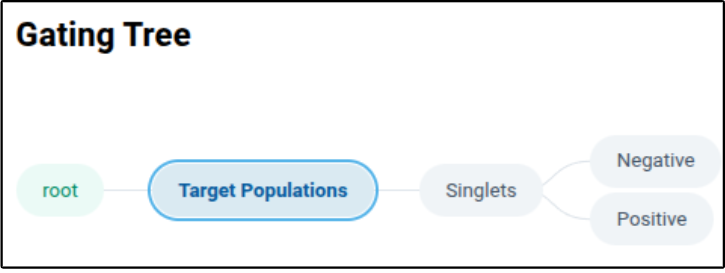
After clicking “Create Template Tree”, the page will update to show you the following tree beneath the “Gating Tree” section of the page
The page will also update on the right side to show you a “Workflow” component.
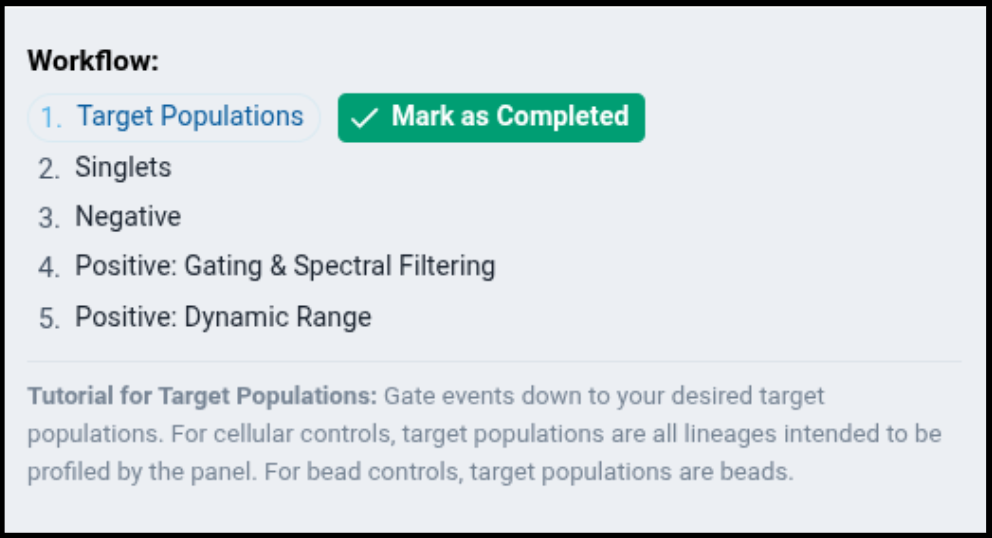
The workflow component provides information about each recommended step in the gating workflow, and will guide you through the process of gating your samples. As you complete each section, click the “Mark as Completed” button to inform the system the step is complete, and to proceed the workflow tutorial to the next step.s:
1. Target Populations
- Purpose: Identify events intended to be profiled by the panel based on their physical parameters, and in general try to remove debris and dead cells.
- Strategy: Set a gate on the provided scatter parameters to capture your events of interest (for example, monocytes and lymphocytes) and exclude small debris.
- If your panel and full-stain samples only profile a subpopulation (e.g. only lymphocytes), you should also only select the subpopulation here.
- But if your panel profiles multiple lineages (e.g. all leukocytes), all lineages should be included by this gate.
- By default, the platform provides a rectangular gate.
- The user can edit the gate by:
- Clicking and dragging vertices
- Double-clicking to add/remove vertices
- Shift + scroll to enlarge/contract gate
- Shift + click and drag to rotate gate
- Once satisfied with the placement of the gate – copy the gate by clicking “Copy Gate” using the three-dot menu at the top right of each sample plot

- Pasting Gates
- Copied gates can be pasted onto individual plots by clicking “Paste Gate” using the three-dot menu as above on the desired sample
- Copied gates can be pasted across all loaded samples in a page by clicking “Paste Gate on all Filtered Samples on this Page” using the three-dot menu in the plotting page toolbar
- Note that this functionality only pastes gates onto plots that are visible and loaded on the page. You may need to increase the number of plots per page and scroll through all plots on the page to ensure the gate is copied onto all samples.
- Alternatively, if you only want to paste the gate onto a subset of samples, you can filter samples by metadata properties using the Filter By menu.

- If desired, you may make additional sample-specific edits to the pasted gates.
- Once you are satisfied with the gating on all samples:
- Click “Save Gates” at the top right of the page
- Click “Mark as Completed” in the workflow section after saving results
2. Singlets
In the workflow component, you should now see
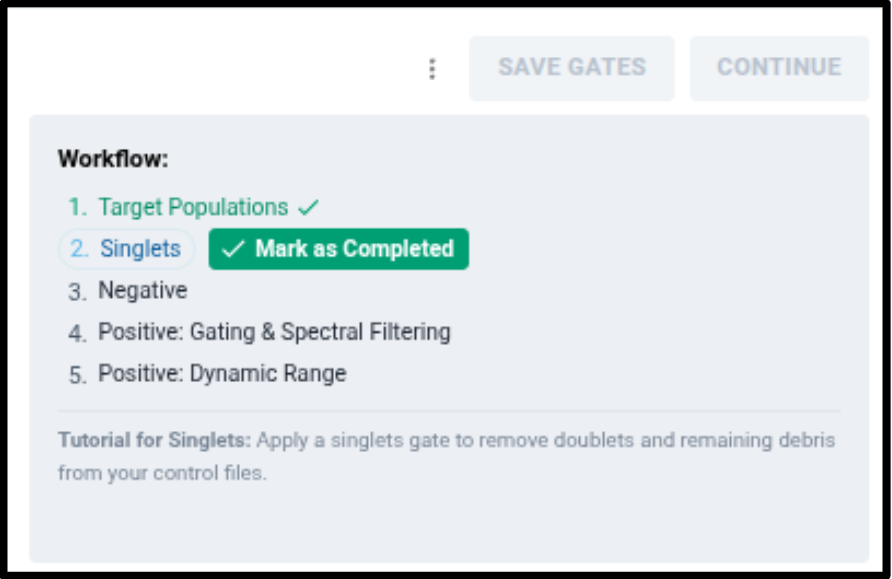
This indicates you have completed applying a gate to all controls that identify all the “Target Populations” profiled by the panel, and that you are now working on a Singlets gate.
- Purpose: Remove doublets and aggregates.
- Follow the same procedure outlined above to adjust the default rectangular gate to capture singlet events.
- Click “Save Gates”
- Click “Mark as Completed” in the Workflow component.
3. Negatives
In the workflow component, you should now see
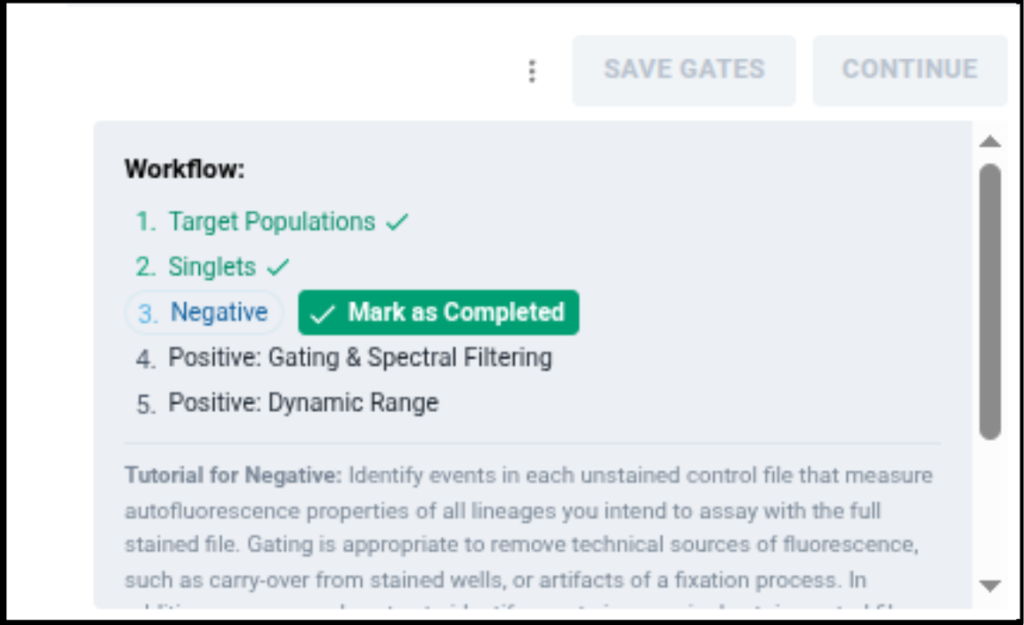
This indicates you have completed applying gates to all controls that identify singlets within the “Target Populations”, and that you are now working on applying a gate to all singlets that identify negative events.
- Purpose: Identify events in each control file that are negative for the indicated fluor. Additionally, identify events in an unstained file that can be used to estimate background for each of the multicolor samples. Events in these gates will be used downstream to estimate event-level autofluorescence.
- If you intend to use an internal negative population as the unstained population for your unmixing, you will need to apply a Negative gate to each control.
- However, if you are planning to use one or more separate unstained controls (e.g. for each material type), you only need to review the unstained control on this node. Verify that the unstained control is not contaminated with fluorescent signal, and then you may move on to Positive gating.
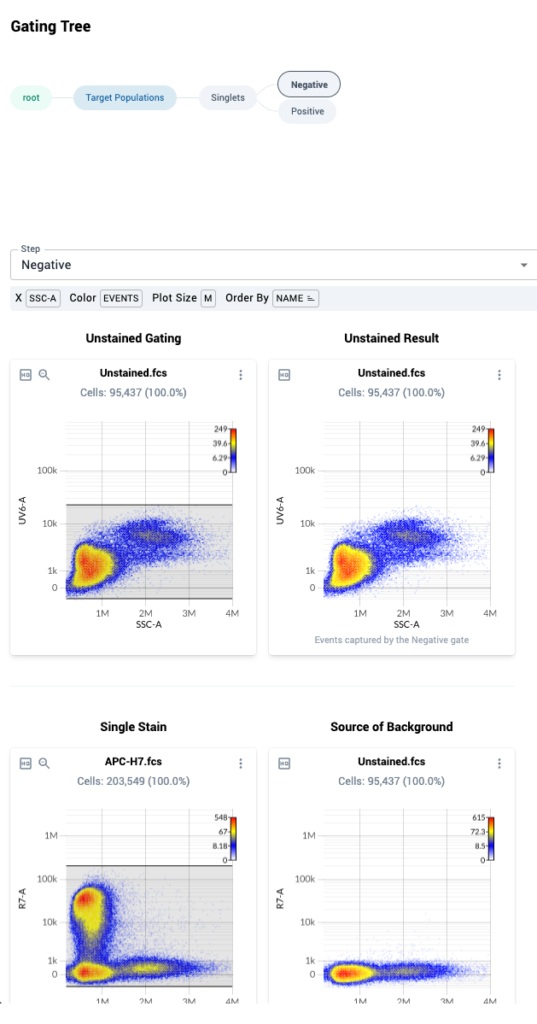
- In the gating tree, you can see that the “Negative” node is highlighted. Below the gating tree, you will see two columns of data.
- The left column shows measurements within the singlets gate for a given control on SSC-A versus the peak detector assigned during in control file upload.
- The right column shows measurements within the singlets gate for the control file that was mapped as “Background” during control file upload for the control file.
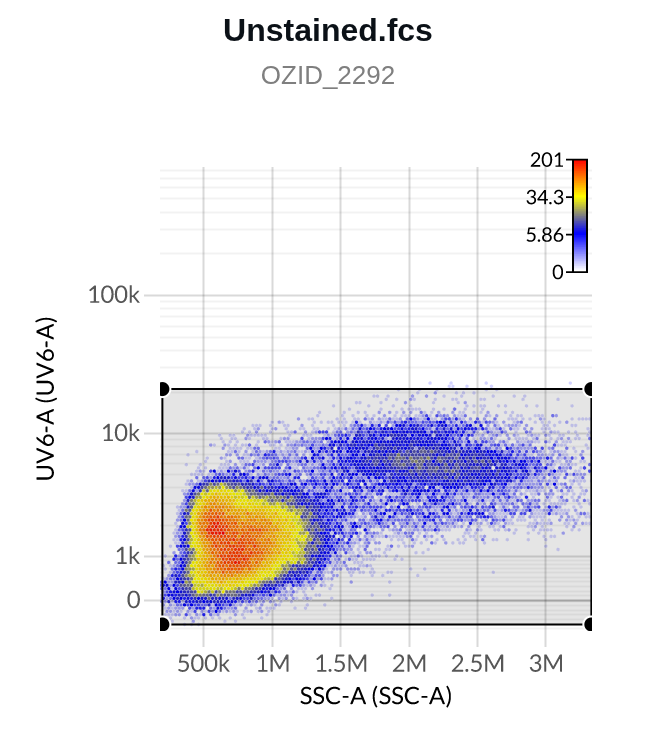
- The first row shows data from the file “Unstained.fcs”, which is the universal unstained control for this experiment. We see the data duplicated in the right-hand column, since this file acts as its own “source of background”. No action needs to be taken here.
- Note: Ozette Resolve displays data from the universal unstained control in this section in order to promote reviewing unstained controls for carry over between wells or other sources of contamination.
- If any such contaminants are detected in an unstained control, they should be gated out, because if included they will bias the event-specific autofluorescence estimate made by the Resolve system.
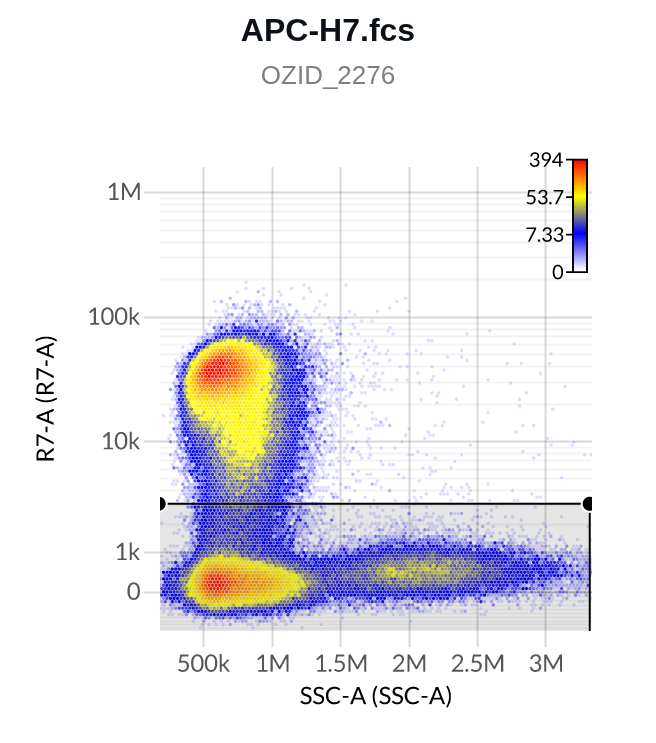
- The second row shows data from the APC-H7 control on the R7-A detector in the left column, and corresponding measurements from the unstained control on the R7-A detector on the right hand column. The data from the unstained control can be used to help set an “internal negative” gate on the APC-H7 control, if the universal unstained control proves inappropriate
- Here are two example Negative gates, one on a single stain control (top), one on the unstained control (bottom; note the detectors on the y-axes differ):
4. Positives
Gating and Spectral Filtering
In the workflow component, you should now see
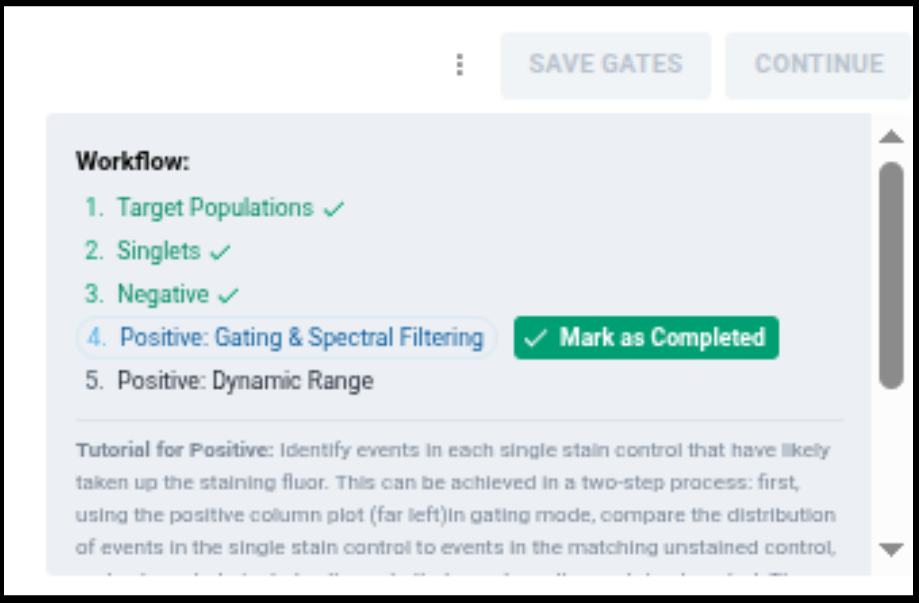
This indicates you have completed identifying events negative for each fluor among gated singlets, and will now identify events positive for each fluor among gated singlets.
- Purpose: Gate events in each single stain control that have taken up the fluor using spectral signatures.The selection of an appropriate reference spectrum is one of the most important actions taken when preparing a control set for unmixing: you are selecting the subset of events that will be carried forward into the adaptive unmixing procedure, and used to unmix the multicolor samples.
- The goal of the filtering procedure is to identify the events within the control that produce measurable variation on the detectors where the reference spectra has expected emission, while driving the emission on detectors where the reference does not emit as close to zero as possible.
- Note: You may observe variation in the spectra for detectors that are expected to measure emission of the indicated fluorochrome relative to the reference spectra provided by the instrument manufacturer.
- Some deviation in the observed spectral signatures in a given control from the theoretical spectral signatures is expected due to experimental conditions (e.g. variation in reagents, instrument configuration, etc.).
- Variation on detectors expected to measure a given fluorochrome’s emission spectrum is useful variation that is used by Resolve to perform event-level unmixing
- Ozette has therefore developed a “Spectra Analysis” view to provide you full insight into the spectra that are being used for your unmixing. Over the next few steps we will instruct you on how to construct Positive gates that select optimal events for spectral estimates.
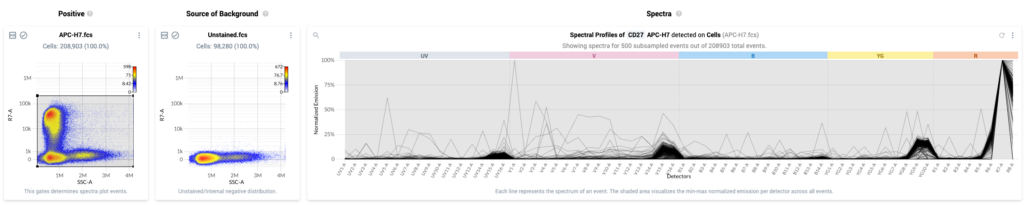
- The Spectra Analysis view is shown by default in the “Positive: Gating & Spectral Filtering” step of the workflow. The view shows:
- Column 1: Positive – This plot displays a physical parameter on the x-axis, and the assigned peak detector of the fluor on the y-axis. This plot also shows a traditional gate that can be used to select events with bright signal in the peak detector. These are events that have likely taken up the fluor.
- Column 2: Source of Background – Plot of all events in the Negative gate for the sample indicated in the plot title. The events are plotted against the same parameters as in column 1.
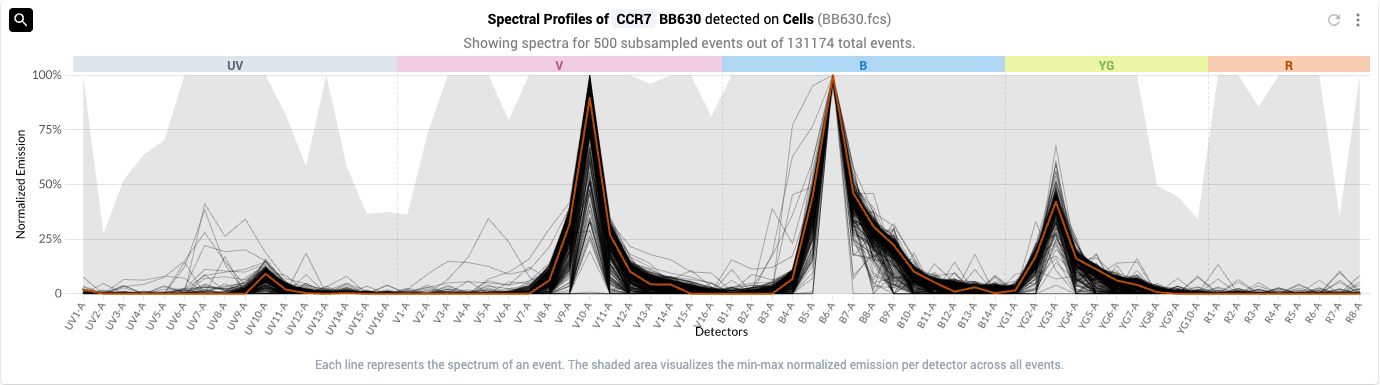
- Column 3: Spectra – Event-level spectral plot displaying the estimated spectra for individual events within the positive gate shown in column 1. Events within the gate are subsampled (when required) such that a maximum of 500 events are shown at a time. Individual spectra are plotted as solid black lines, and the gray bands show the distribution of normalized emission across all estimated spectra within the gate.
- This view for a single control looks like the following:
- How to use these plots:
- Column 1:
- Adjusting the position of the gate in the 1st column will automatically update the spectra displayed in the 3rd column. The goal is to select bright, positive events with spectra that are similar to the ideal spectra for the indicated fluor.
- Tip: If a single stain control has events at the limit of the detector for your instrument, you should exclude these events from your Positive gate. These often represent antibody aggregates or debris that can impair accurate cell-level spectral estimation.
- Column 2:
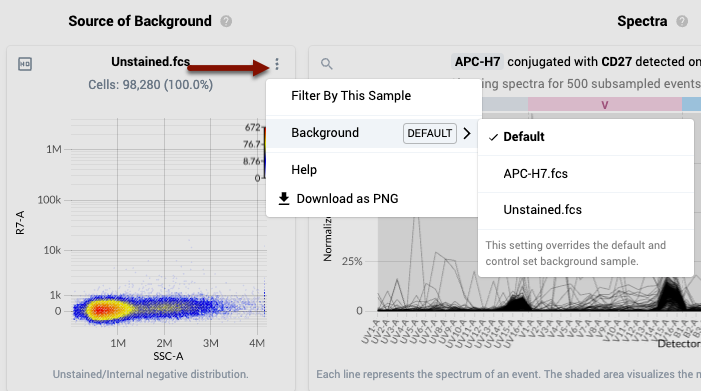
- When you initially upload the single stain and unstained controls, you can specify the file that should be used to estimate background for each single stain file by listing a file name in the “Background” column on the Control Files upload page. This file is usually an unstained control of a corresponding material type to the respective single stain controls. If you want to use an internal negative, list the single stain control itself in the Background column.
- By default, the platform will use this mapping to choose which file will be shown in the “Background” column on the Spectra Analysis view. You can verify that the platform is using this “Default” file by reviewing the “Background File” menu setting in the task bar.
- To change the file used for Background for a specific single stain control, open the three dot menu at the top right of the corresponding “Source of Background” plot in the second column, and navigate to the “Background” sub menu. Here you can choose any unstained control or the single stained control itself. In the latter case, the cells selected in the “Negative” gate for that single stain control that you defined earlier will be plotted in the Background column (an “internal negative”).
- IMPORTANT NOTE: The material type of the single stain control and the selected Background file should always have comparable autofluorescence characteristics: the simplest way to achieve this is to make sure they are the same material and that the unstained file has enough events so that each cellular population profiled by the panel is well represented.
- Column 3
- Events that are displayed in the spectral plot are subsampled from within the Positive gate to preferentially display events with spectra that have a higher likelihood of having taken up the fluor. The Spectra plot will be updated to show the spectral estimates as you edit the Positives gates: here we show the updated view for the control BB630
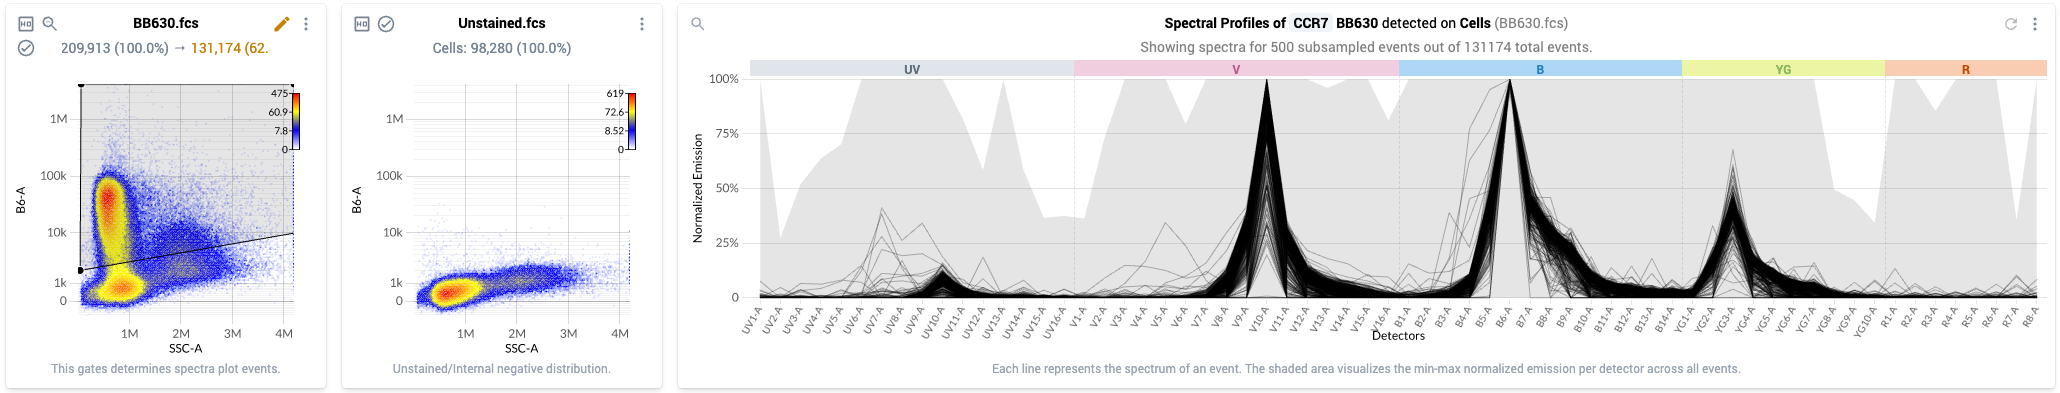
- If required, the spectra can be refreshed to show a different subsample of events in the current Positive gate by clicking the refresh button in the top left of the spectral plot

- In addition to displaying a subset of event-specific spectra, the spectral plot also displays the distribution of spectral-intensities of all events in the Positives gates using a light-gray overlay.
- Events that are displayed in the spectral plot are subsampled from within the Positive gate to preferentially display events with spectra that have a higher likelihood of having taken up the fluor. The Spectra plot will be updated to show the spectral estimates as you edit the Positives gates: here we show the updated view for the control BB630
- Column 1:
- Strategy: For each single stain control, we recommend first setting the positive gate to initially include all events above the data displayed in column 2
- Once the initial positive gate has been set, the spectra plot should contain a dominant pattern produced by the fluor in your data
- Note that for complex material (e.g. tissue) and markers that are rarely expressed, the plot may also show mixture of spectral patterns
- If no pattern is evident, moving the gate up to select the most strongly positive events can help identify the spectral pattern. However, do not select positive events at the limit of detection for the detector.
- Once you have selected a Positive population using the gate, you next need to filter the events within the Positive gate to events that have the most ideal spectra. Using spectra that are maximally similar to the “ideal” spectrum defined for each fluorophore is critical for optimal unmixing.
- Select a specific event to use as a reference spectrum by mousing over the spectral plot and left-clicking on specific events
- The selected event will initially show as orange.
- Tip: for fluors with multiple peaks, selecting an event based on the emission pattern of a secondary or tertiary peak can help identify a desirable reference event
- The selected event will initially show as orange.
- Once you have selected a reference event, you then must apply spectral filtering to the gate, in order to select events in the gate with similar spectral profiles to your reference
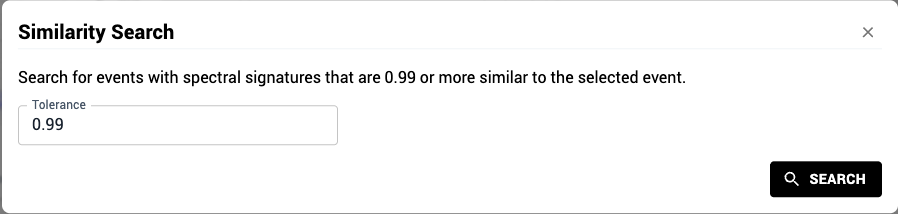
- You can initiate spectral filtering by clicking on the magnifying glass icon in the upper left-hand corner of the spectral plot

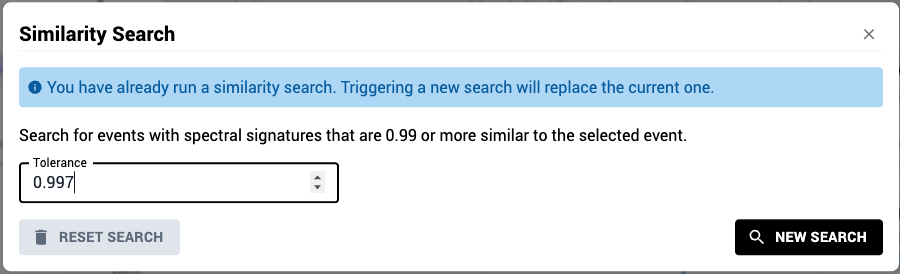
- Once you click on the spectral filtering tool, a modal will appear that lets you set a filtering parameter called “Tolerance”. This parameter will be used by Resolve to select events similar to your reference spectrum: setting the parameter value to values close to 1 will return events with very similar spectra (a value of 1 will return only the event itself, an exact match)
- We recommend using the default value of 0.99 as a starting point. After applying the spectral filter to a fluor, it is often beneficial to increment and filter again, to ensure that the shape of the emission spectra produced by all events found by the filter are comparable to the selected reference event.
- We recommend using the default value of 0.99 as a starting point. After applying the spectral filter to a fluor, it is often beneficial to increment and filter again, to ensure that the shape of the emission spectra produced by all events found by the filter are comparable to the selected reference event.
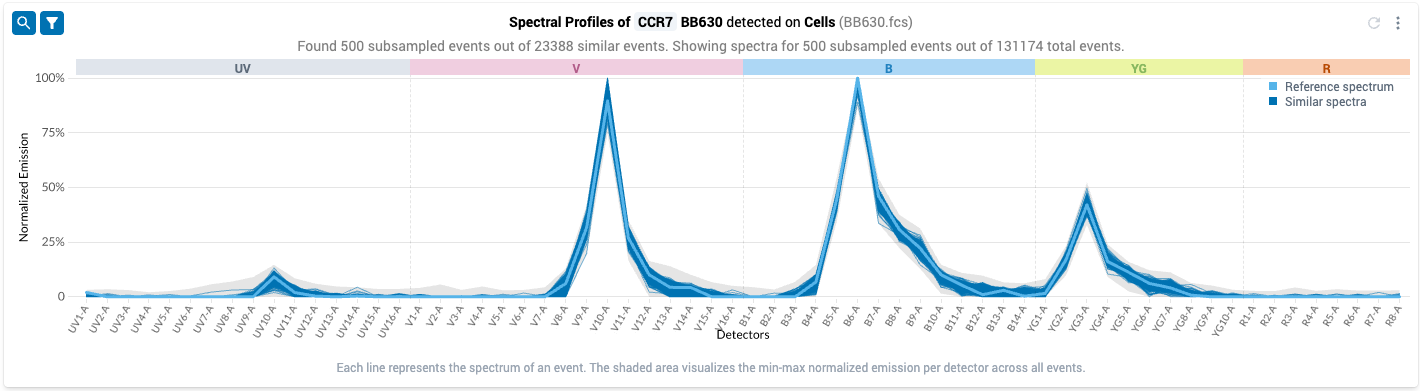
- Once you apply spectral filtering, the system will search within the positive gate on the control file for events with similar spectra, and update the plot to display all the matching events (dark blue), alongside the reference spectrum (light blue). The events in black are within the positive gate, but their spectra were outside the similarity tolerance; they will be excluded from the final Positive gate.
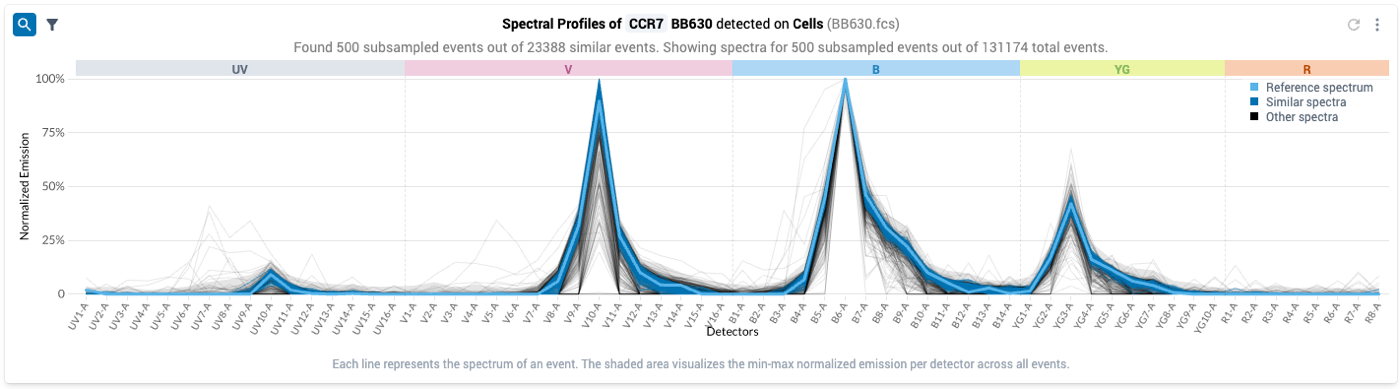
- To only view the events in the gate that match your spectral reference, you can click on the Funnel Icon on the upper lefthand side of the plot

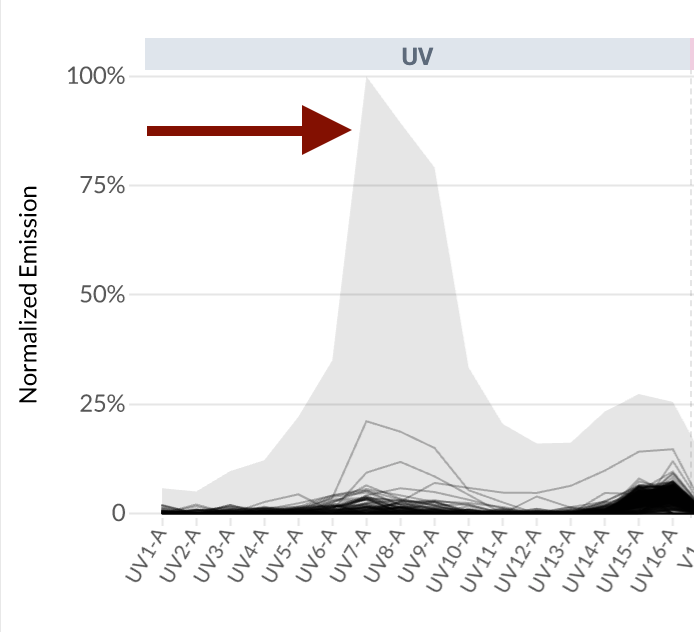
- After clicking this icon, the plot updates to show only the events that were found by the spectral filtering procedure: the spectral estimates now look more similar to known spectra for BB630. Note that the grey band showing the distribution of intensities has shrunk considerably: the filtered events have all likely taken up the fluor.
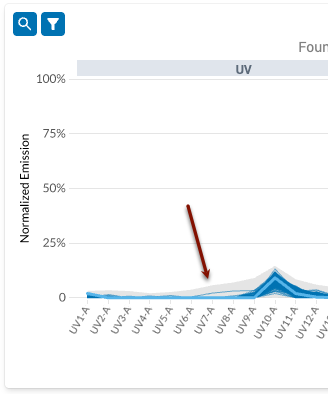
- However, when we inspect the filtered plot, we can see that some events in the collection produce measurable emissions on detectors where the reference spectrum does not: see the gray band above UV7-A.
- To ensure selection of the appropriate spectrum, iteratively filter the control by clicking on the magnifying glass icon and then modifying the tolerance value.
- The reference spectrum will remain fixed across different tolerance settings.
- The reference spectrum will remain fixed across different tolerance settings.
- After updating the tolerance value, click the “New Search” button to update the spectral filter using the new tolerance. The filtered plot will update automatically once the search completes.
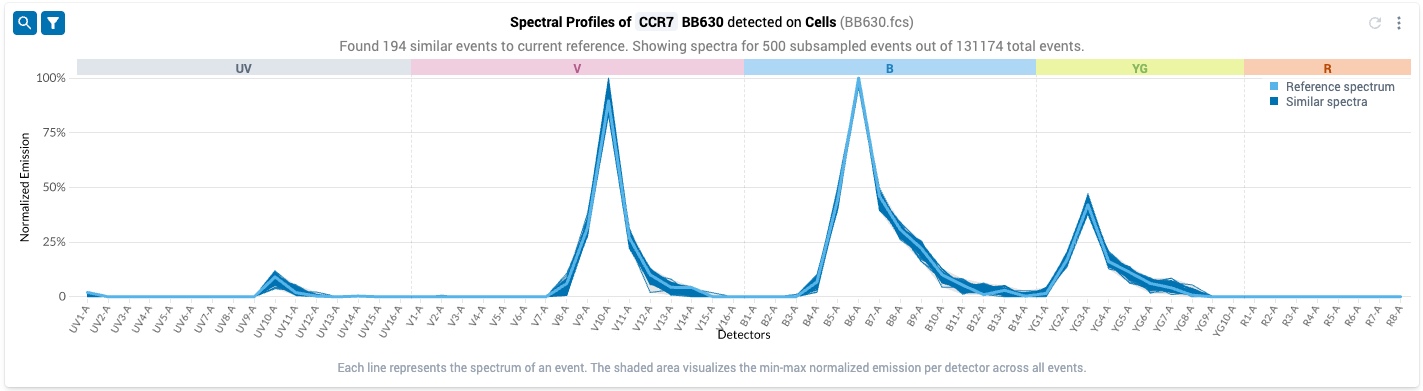
- Note that you no longer observe the gray bands on detector UV-7, while we still observe empirical variation in the emission spectra on the detectors where the reference spectrum has non-zero measurements
- Carry out this filtering procedure for each control in your panel
- Once the initial positive gate has been set, the spectra plot should contain a dominant pattern produced by the fluor in your data
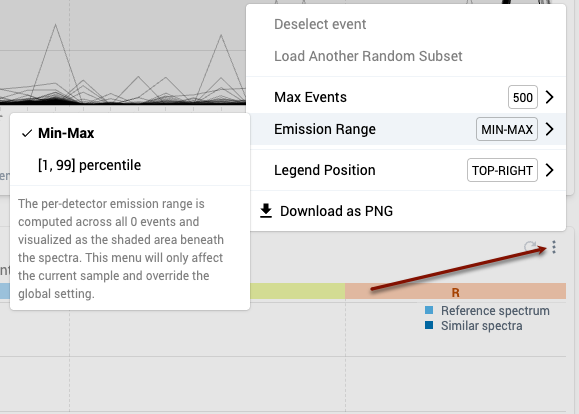
- While you are iterating through the Spectral Filtering procedure, you may consider updating the Emission Range setting:
- By default, the platform shows the full range of spectral estimates for events within the positive gate.
- To change this display setting for the spectral plots for all samples, use the Emission Range menu in the task bar to select “[1,99] percentile”.
- To change this display setting for the spectral plot for a specific sample, click on the three dot menu at the top right of the corresponding spectral plot. Navigate to the Emission Range sub-menu and select “[1,99] percentile”.
- Note that the Emission Range menu in the task bar now reads “mixed.”
- Note that the Emission Range menu in the task bar now reads “mixed.”
- By default, the platform shows the full range of spectral estimates for events within the positive gate.
- Tip: Note on rare events: Some single-stain controls may have very few positive cells. The Positive gate must need only contain one event with an optimal spectrum (though it may include more). This will be sufficient for Ozette Resolve unmixing!
- Once satisfied with events that have been selected within the Positive gates select “Save Gates”
Dynamic Threshold
In the workflow component, you should now see
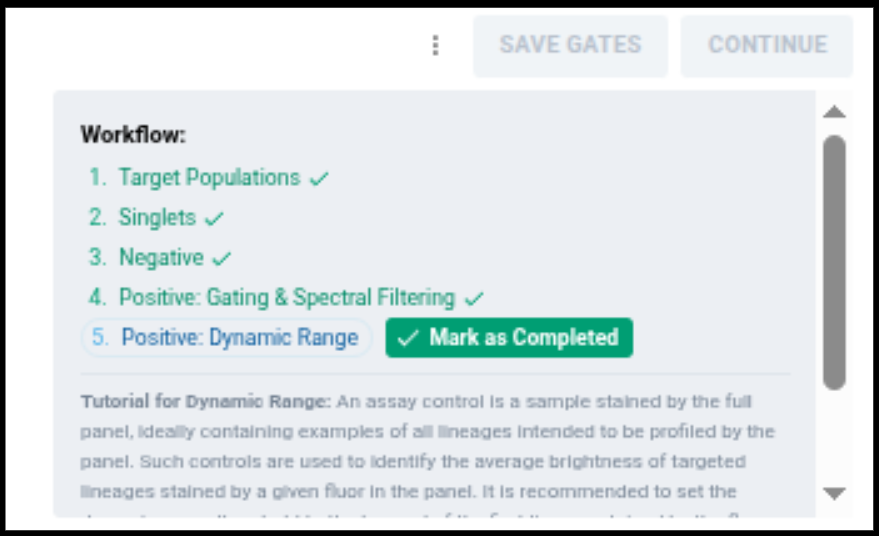
This indicates you have completed identifying events positive for the fluor among gated singlets for each control in your experiment, and now are working on setting the dynamic range for the unmixing experiment.
- Purpose: Resolve uses data in the positive gate to estimate unmixing error (commonly called “spreading error”) for each fluorophore in the panel, as well as transformation parameters for downstream analysis. This error estimate is incorporated into the final output produced by Resolve, and allows the system to estimate a lower bound on background for each of the unmixed parameters.
- Controls are often prepared to maximize the brightness of each staining fluor. This can produce controls whose positive intensities are much brighter or dimmer than than the same biological material stained by the full multicolor cocktail. In such cases – and without adjustment – Resolve can over-estimate unmixing error, potentially compromising the resolution of some markers in the panel.
- The Dynamic Range workflow component provides an in-silico mechanism to account for intensity mismatches between controls and full-stained material, allowing Resolve to estimate unmixing error on-scale with your multicolor data.
- In this component of the workflow, you will set a threshold for each fluor that indicates the brightness of the brightest biologically-relevant population within the full-stained samples.
- This threshold is set by comparing the single-stained control to the uploaded “Assay Control” file, as well as the unstained material.
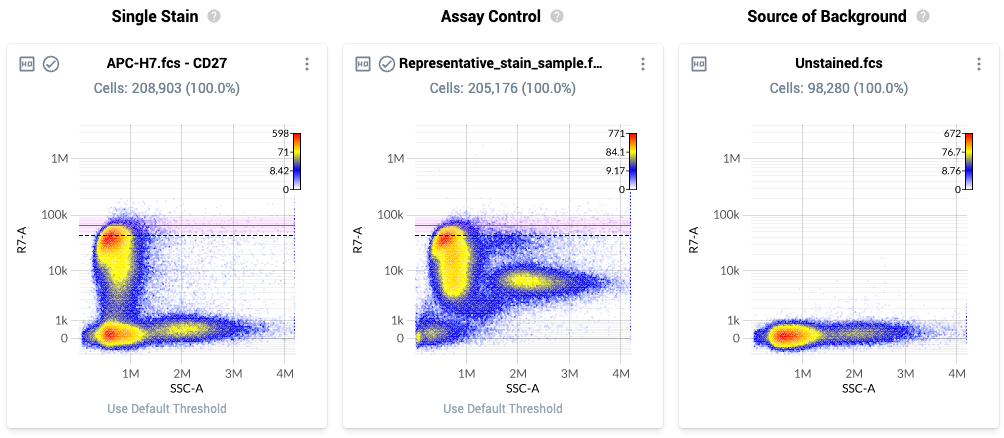
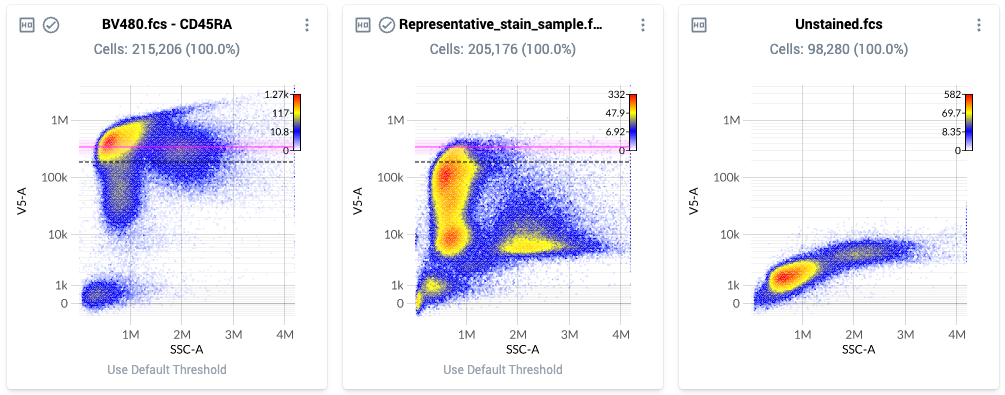
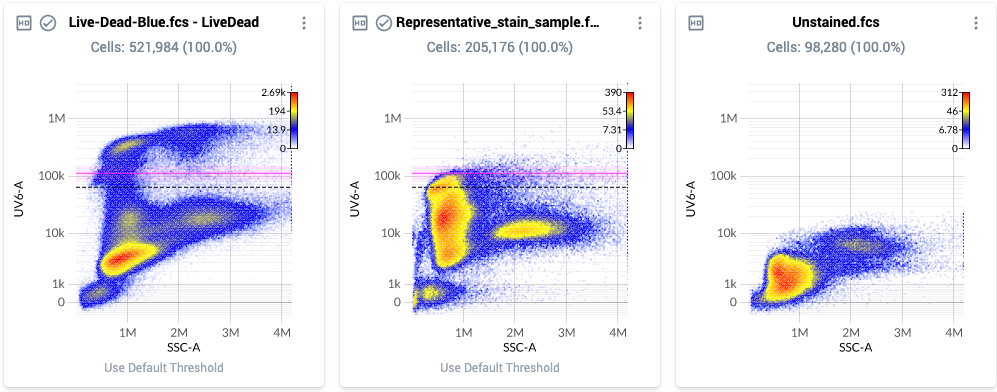
- The Resolve system assists you in setting this parameter by providing a three-column view
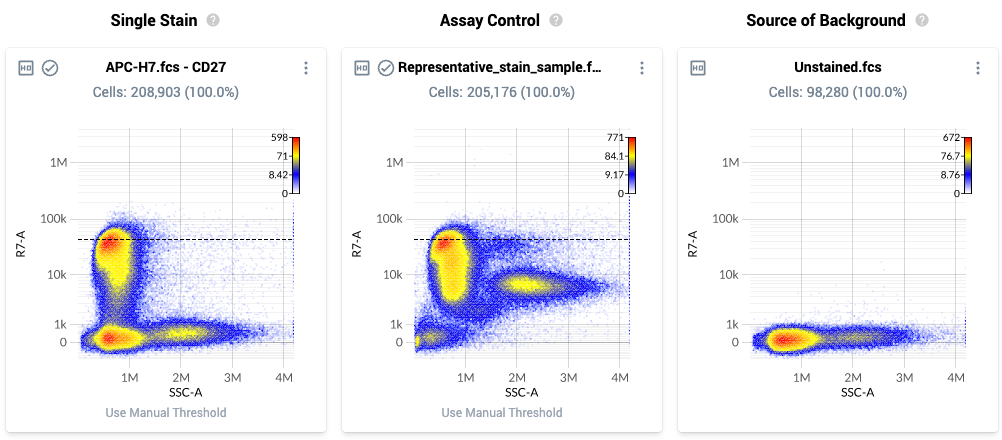
- The page layout is as follows:
- Column 1: Single Stain – Plot of all events within the singlets gate for a single stain control. The plot displays a physical parameter on the x-axis, and the assigned peak detector for the fluorophore on the y-axis. The dashed black line is the default dynamic range threshold for that fluor.
- Column 2: Assay Control – Plot of all events within the singlest gate for the uploaded Assay Control. The events are plotted against the same parameters as in column 1, and the dashed black line is the default setting of the dynamic range parameter for that fluor.
- If no assay control file is uploaded, this plot will be empty.
- Column 3: Source of Background – Plot of all events within the Negative gate for the source-of-background file.
- Strategy:
- If the default threshold position is at the top end of the brightest biologically-relevant population in the assay control, you may leave the default threshold as-is. No additional editing is required for that sample.
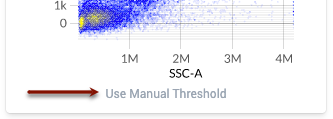
- If the default value of the threshold is higher than the top-end of the brightest biologically-relevant population in the assay control, click the “Use Manual Threshold” button below the plot to enable you to move the threshold.
- After clicking this button, the threshold will become a brightly colored line.
- The text under the plot will also change to “Use Default Threshold”. Click “Use Default Threshold” at any time to revert back to the default threshold location for that sample.
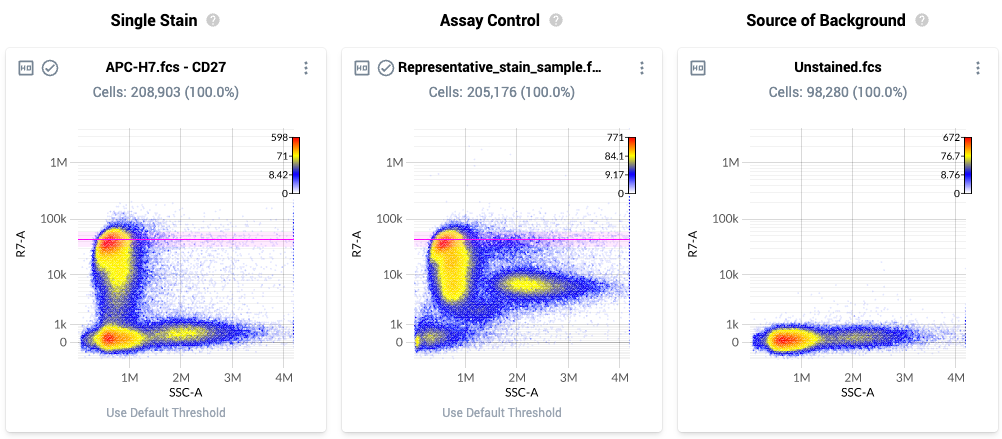
- The threshold location is paired between the first and second plot for each line. Using the Assay Control, increase (or decrease) the threshold location so it is located at the top of the brightest biologically-relevant population in theAssay Control.
- The new threshold values are automatically saved.
- Repeat this procedure for each single stained control in the experiment.
- Example threshold locations are shown below. Note how each threshold is located at the top end of the bulk brightest population, rather than at the very brightest event:
- Once satisfied with the placement of the thresholds, mark this section as ”Completed” in the workflow window.
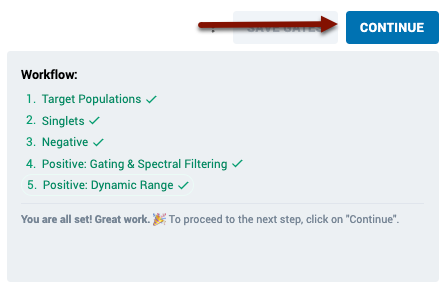
Now that you have completed each section of the workflow, click “Continue” to move on to finalizing your control set.
- The text under the plot will also change to “Use Default Threshold”. Click “Use Default Threshold” at any time to revert back to the default threshold location for that sample.
- Dynamic Range Tips
- If you do not upload an “AssayControl” file to your control set, Resolve will set default dynamic range threshold locations based on the distribution of measurements in the matched unstained control in the peak-detector for a fluor.
- In such cases, you can still modify the dynamic range setting for each fluorophore in the Resolve system, but should only do so if you have full-stained material on the same scale to compare against in another system (e.g. from an independent analysis in your analysis software of choice).
- The settings based on the unstained material are conservative, and can produce sub-optimal error estimates. It is strongly recommended to upload a representative “AssayControl” file if possible. Note that this sample does not have to be a true Assay Control–it can be any full stain sample from your experiment. However, the more representative the sample is of the “average” sample in your experiment, the better the results will be.
- If you upload an AssayControl that has multiple positive populations for a staining fluor, it is recommended to set the dynamic range setting to intensities at the top of the first positive population.
- If in doubt, setting the dynamic range to a lower setting is recommended.
5. Finalize single stain files that are used for unmixing
- The final step of control set creation is to select the final set of controls to be used for unmixing. This may include excluding samples for the following reasons:
- Low quality or problematic files: in the process of clean up gating and spectra analysis you may identify controls that have undesirable features that may prevent correct unmixing. You will want to exclude these controls from analysis and use a different control instead.
- Duplicate control files: recall that you can create control sets with multiple controls per fluorophore. Before proceeding to unmixing controls, you must filter down to a single control per fluorophore.
- You do not need to exclude Unstained or Assay Control files. These will be automatically excluded from unmixing.
- To exclude a sample, use the three dot menu at the top right of the individual sample plot and select “Exclude Sample”. The sample will then show as shaded blue, indicating that the sample has been excluded from downstream analysis. You may perform this exclusion on any node in the gating tree.
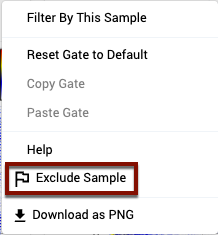
- Excluded samples will appear with an orange background and flag in the top left corner. To remove the exclusion, click “include sample” from the three-dot menu or click on the flag in the top left corner.
Now that you have completed each section of the gating workflow, click “Continue” to move on to finalizing your control set.
Finalizing the Control Set
Specify source of background
- To finalize the control set, you must specify the source of background to be used for each control file.
- During file upload you assigned a source of background to each control. If these assignments are still appropriate, you may simply proceed to unmixing.
- If in the course of cleanup gating and Spectra Selection you decide you want to change the assigned source of background, you may change these assignments on this final page.
- The updated source of background can point at an unstained file or the control itself. If you select the control itself, the system will use that file’s Negative gate to estimate background.
- This choice should match the choice you made for the Background column when performing Positive gating.
- To update the selected file, double click on the cell corresponding to the Background column and the desired control row. You will then be able to select the desired file from a drop down menu.
Optional: Iterating on Control Sets
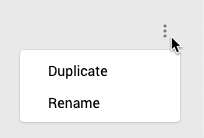
- If needed, you can duplicate a control set to retain the selected files and edit the gating. Duplicating a control set can be done by clicking into the control set and then using the three dot menu in the top right corner
- When you duplicate a control set or create a new control set from a new set of files, you may also inherit your gating from a previous control set as described above.